

ASR1 mediates glucose-hormone cross talk by affecting sugar trafficking in tobacco plants
- PMID: 23302128
- PMCID: PMC3585611
- DOI: 10.1104/pp.112.208199
ASR1 mediates glucose-hormone cross talk by affecting sugar trafficking in tobacco plants
Abstract
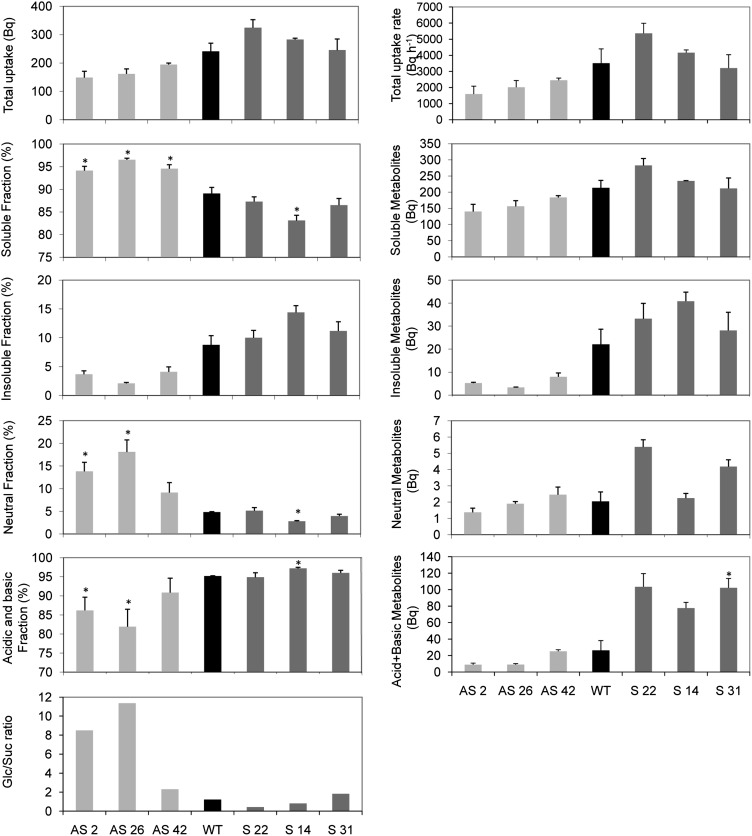
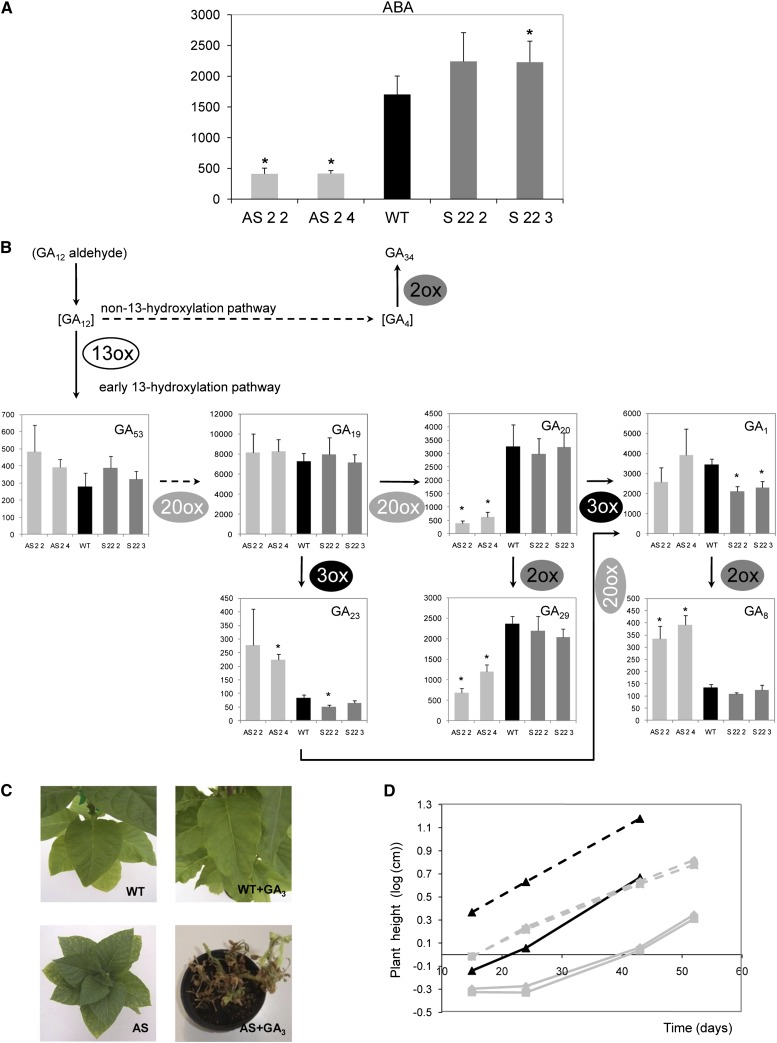
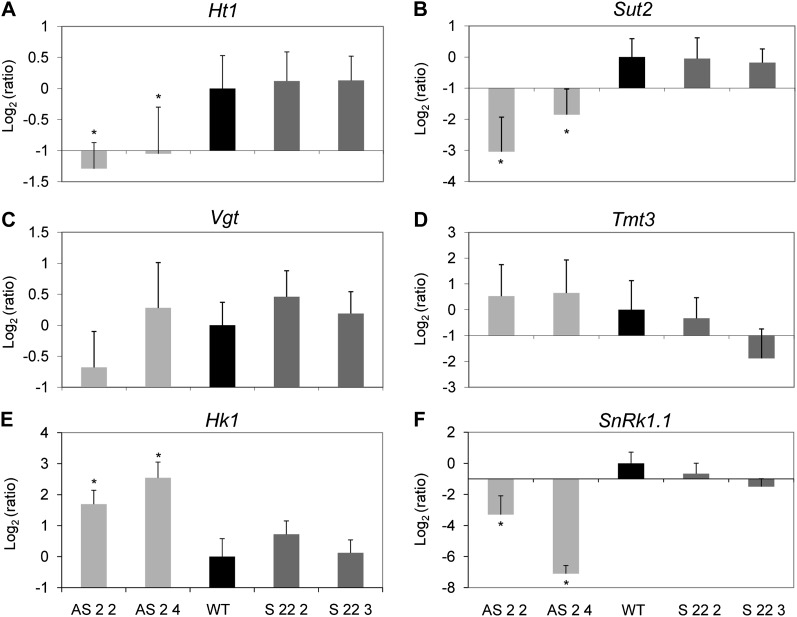
Asr (for ABA, stress, ripening) genes are exclusively found in the genomes of higher plants, and the encoded proteins have been found localized both to the nucleus and cytoplasm. However, before the mechanisms underlying the activity of ASR proteins can be determined, the role of these proteins in planta should be deciphered. Results from this study suggest that ASR is positioned within the signaling cascade of interactions among glucose, abscisic acid, and gibberellins. Tobacco (Nicotiana tabacum) transgenic lines with reduced levels of ASR protein showed impaired glucose metabolism and altered abscisic acid and gibberellin levels. These changes were associated with dwarfism, reduced carbon dioxide assimilation, and accelerated leaf senescence as a consequence of a fine regulation exerted by ASR to the glucose metabolism. This regulation resulted in an impact on glucose signaling mediated by Hexokinase1 and Snf1-related kinase, which would subsequently have been responsible for photosynthesis, leaf senescence, and hormone level alterations. It thus can be postulated that ASR is not only involved in the control of hexose uptake in heterotrophic organs, as we have previously reported, but also in the control of carbon fixation by the leaves mediated by a similar mechanism.
Figures
Similar articles
-
Expression of geminiviral AC2 RNA silencing suppressor changes sugar and jasmonate responsive gene expression in transgenic tobacco plants.BMC Plant Biol. 2012 Nov 7;12:204. doi: 10.1186/1471-2229-12-204. BMC Plant Biol. 2012. PMID: 23130567 Free PMC article.
-
ABA and GA3 increase carbon allocation in different organs of grapevine plants by inducing accumulation of non-structural carbohydrates in leaves, enhancement of phloem area and expression of sugar transporters.Physiol Plant. 2016 Mar;156(3):323-37. doi: 10.1111/ppl.12390. Epub 2015 Oct 26. Physiol Plant. 2016. PMID: 26411544
-
Expression of a carotenogenic gene allows faster biomass production by redesigning plant architecture and improving photosynthetic efficiency in tobacco.Plant J. 2020 Sep;103(6):1967-1984. doi: 10.1111/tpj.14909. Epub 2020 Aug 1. Plant J. 2020. PMID: 32623777
-
Investigation of the ASR family in foxtail millet and the role of ASR1 in drought/oxidative stress tolerance.Plant Cell Rep. 2016 Jan;35(1):115-28. doi: 10.1007/s00299-015-1873-y. Epub 2015 Oct 6. Plant Cell Rep. 2016. PMID: 26441057
-
ASR1 transcription factor and its role in metabolism.Plant Signal Behav. 2015;10(4):e992751. doi: 10.4161/15592324.2014.992751. Plant Signal Behav. 2015. PMID: 25794140 Free PMC article. Review.
Cited by
-
OsASR2 regulates the expression of a defence-related gene, Os2H16, by targeting the GT-1 cis-element.Plant Biotechnol J. 2018 Mar;16(3):771-783. doi: 10.1111/pbi.12827. Epub 2017 Oct 10. Plant Biotechnol J. 2018. PMID: 28869785 Free PMC article.
-
Hormonal impact on photosynthesis and photoprotection in plants.Plant Physiol. 2021 Apr 23;185(4):1500-1522. doi: 10.1093/plphys/kiaa119. Plant Physiol. 2021. PMID: 33793915 Free PMC article. Review.
-
Quantitative Proteomics Analysis of ABA- and GA3-Treated Malbec Berries Reveals Insights into H2O2 Scavenging and Anthocyanin Dynamics.Plants (Basel). 2024 Aug 25;13(17):2366. doi: 10.3390/plants13172366. Plants (Basel). 2024. PMID: 39273850 Free PMC article.
-
OsASR6 Enhances Salt Stress Tolerance in Rice.Int J Mol Sci. 2022 Aug 19;23(16):9340. doi: 10.3390/ijms23169340. Int J Mol Sci. 2022. PMID: 36012605 Free PMC article.
-
Abiotic stress responsive rice ASR1 and ASR3 exhibit different tissue-dependent sugar and hormone-sensitivities.Mol Cells. 2013 May;35(5):421-35. doi: 10.1007/s10059-013-0036-7. Epub 2013 Apr 24. Mol Cells. 2013. PMID: 23620302 Free PMC article.
References
-
- Amitai-Zeigersona H, Scolnik P, Bar-Zvi D. (1995) Tomato Asrl mRNA and protein are transiently expressed following salt stress, osmotic stress and treatment with abscisic acid. Plant Sci 110: 205–213
-
- Arenhart R, Lima J, Pedron M, Carvalho F, Silveira J, Rosa S, Caverzan A, Andrade C, Schünemann M, Margis R, et al. (2013) Involvement of ASR genes in aluminium tolerance mechanisms in rice. Plant Cell Environ 36: 52–67 - PubMed
Publication types
MeSH terms
Substances
LinkOut - more resources
Full Text Sources
Other Literature Sources
