Clinical Trial
. 2013 Jan 9:13:8.
doi: 10.1186/1472-6882-13-8.

The biomechanical demands of standing yoga poses in seniors: The Yoga empowers seniors study (YESS)

Affiliations
Clinical Trial

The biomechanical demands of standing yoga poses in seniors: The Yoga empowers seniors study (YESS)

Man-Ying Wang et al. BMC Complement Altern Med. .

Abstract

Background: The number of older adults participating in yoga has increased dramatically in recent years; yet, the physical demands associated with yoga performance have not been reported. The primary aim of the Yoga Empowers Seniors Study (YESS) was to use biomechanical methods to quantify the physical demands associated with the performance of 7 commonly-practiced standing yoga poses in older adults.

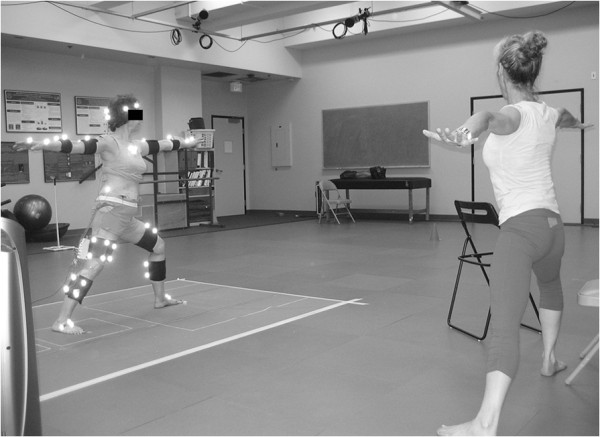
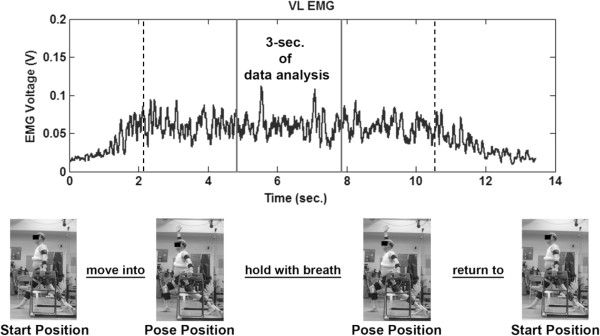
Methods: 20 ambulatory older adults (70.7+-3.8 yrs) attended 2 weekly 60-minute Hatha yoga classes for 32 weeks. The lower-extremity net joint moments of force (JMOFs), were obtained during the performance of the following poses: Chair, Wall Plank, Tree, Warrior II, Side Stretch, Crescent, and One-Legged Balance. Repeated-measure ANOVA and Tukey's post-hoc tests were used to identify differences in JMOFs among the poses. Electromyographic analysis was used to support the JMOF findings.

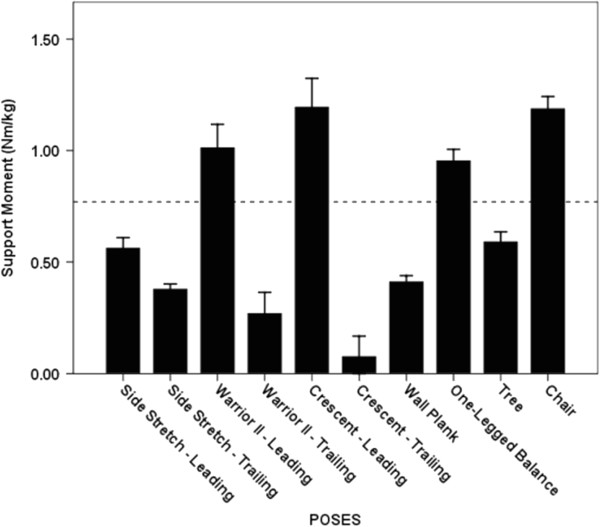
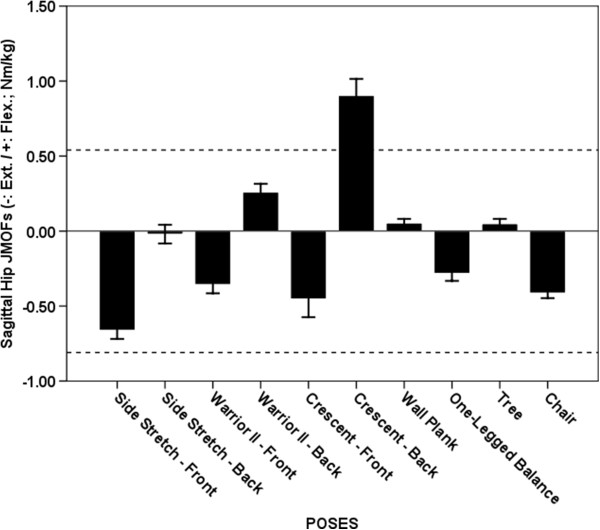
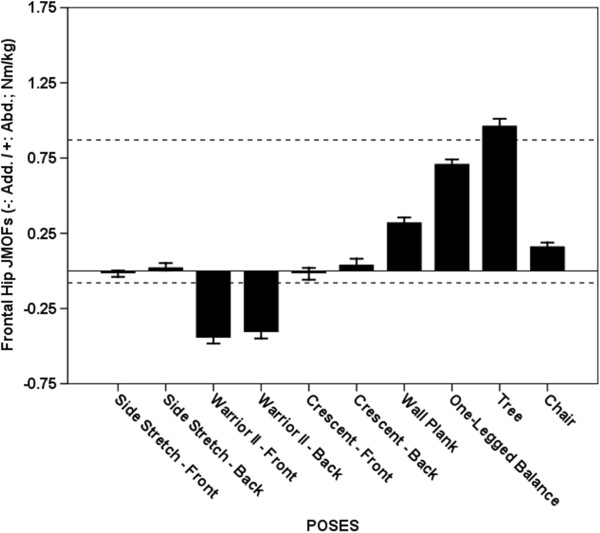
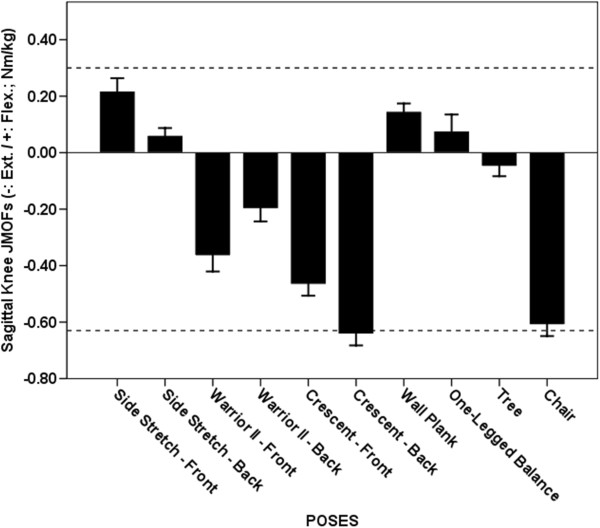
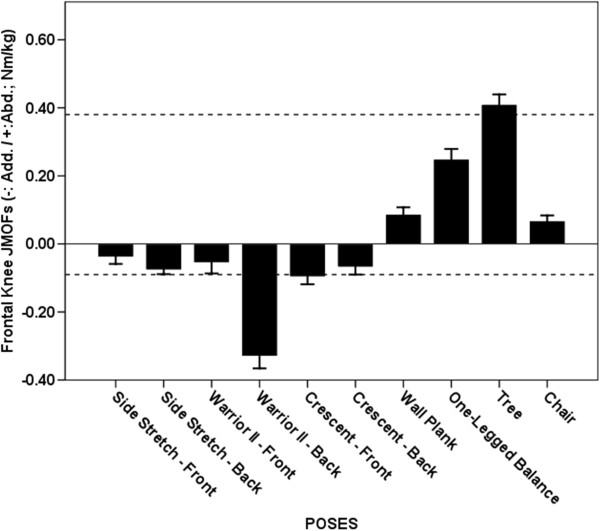
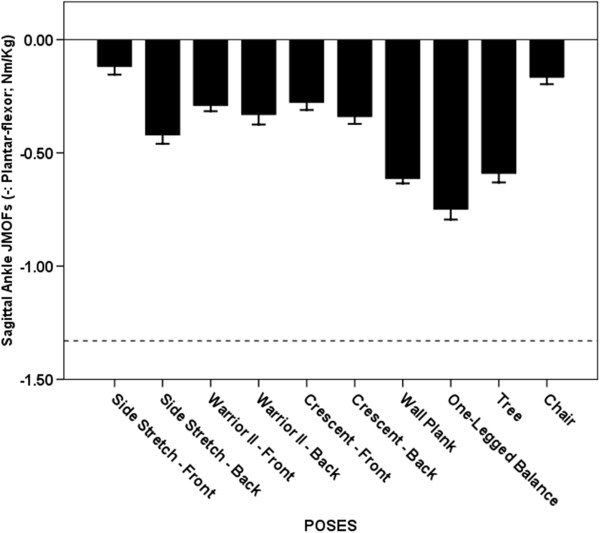
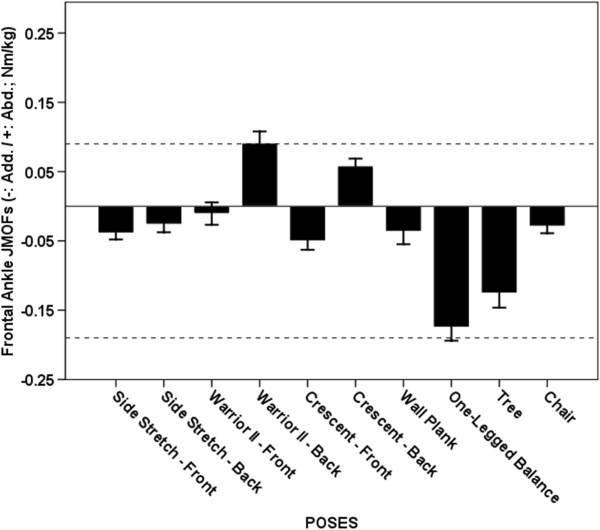
Results: There was a significant main effect for pose, at the ankle, knee and hip, in the frontal and sagittal planes (p=0.00-0.03). The Crescent, Chair, Warrior II, and One-legged Balance poses generated the greatest average support moments. Side Stretch generated the greatest average hip extensor and knee flexor JMOFs. Crescent placed the highest demands on the hip flexors and knee extensors. All of the poses produced ankle plantar-flexor JMOFs. In the frontal plane, the Tree generated the greatest average hip and knee abductor JMOFs; whereas Warrior II generated the greatest average hip and knee adductor JMOFs. Warrior II and One-legged Balance induced the largest average ankle evertor and invertor JMOFs, respectively. The electromyographic findings were consistent with the JMOF results.

Conclusions: Musculoskeletal demand varied significantly across the different poses. These findings may be used to guide the design of evidence-based yoga interventions that address individual-specific training and rehabilitation goals in seniors.

Clinical trial registration: This study is registered with NIH Clinicaltrials.gov #NCT 01411059.

Trial registration: ClinicalTrials.gov NCT01411059.


Figures

Figure 1
Figure 1
An instrumented participant performing the Warrior II pose while guided by the yoga instructor.
Figure 2
Figure 2
EMG signal of the Vastus Lateralis during performance of the Crescent pose. Data analysis was conducted on the middle 3 seconds (between solid lines), during the static portion of the pose (between dashed lines).
Figure 3
Figure 3
Average Support moments. The dashed line indicates the average peak support moment generated during walking at a self-selected speed. The whiskers represent standard errors. There was no statistically significant difference among the 4 poses generating the greatest average support moments (p = 0.07 – 1.00).
Figure 4
Figure 4
Average Hip JMOFs in the sagittal plane. The dashed lines indicate the average peak JMOF generated during walking at a self-selective speed. The whiskers represent standard errors. Average flexor JMOFs: Crescent Trailing > Warrior II Trailing, Wall Plank & Tree (p < 0.001, d = 1.7 – 2.4); Warrior II Trailing > Tree (p = 0.043, d = 1.0). Average extensor JMOFs: Side Stretch Leading > Chair (p = 0.018, d = 1.2), Warrior II Leading (p = 0.002, d = 1.2) & One-legged Balance (p < 0.001, d = 1.5).
Figure 5
Figure 5
Average Hip JMOFs in the frontal plane. The dashed lines indicate the average peak JMOF generated during walking at a self-selective speed. The whiskers represent standard errors. Average abductor JMOFs: Tree > One-legged Balance, Wall Plank & Chair (p < 0.001, d = 1.6 – 5.3); One-legged Balance > Wall Plank & Chair (p < 0.001, d = 3.0 – 4.9); Wall Plank > Chair (p < 0.001, d = 1.4). Average adductor JMOFs: Warrior II Leading > Crescent Leading & Side Stretch Leading (p < 0.001, d = 2.4 – 2.6); Warrior II Trailing > Crescent Leading & Side Stretch Leading (p < 0.001, d = 2.1 – 2.2).
Figure 6
Figure 6
Average Knee JMOFs in the sagittal plane. The dashed lines indicate the average peak JMOFs generated during walking at a self-selective speed. The whiskers represent standard errors. Average flexor JMOFs: Side Stretch Leading > One-legged Balance (p = 0.048, d = 0.6) & Side Stretch Trailing (p = 0.023, d = 1.0). Average extensor JMOFs: Crescent Trailing > Crescent Leading (p = 0.006, d = 0.9) & Warrior II Leading (p < 0.001, d = 1.2); Chair > Crescent Leading (p = 0.035, d = 0.8)& Warrior II Leading (p < 0.001, d = 1.1).
Figure 7
Figure 7
Average Knee JMOFs in the frontal plane. The dashed lines indicate the average peak JMOFs generated during walking at a self-selective speed. The whiskers represent standard errors. Average abductor JMOFs: Tree > One-legged Balance, Wall Plank & Chair (p < 0.001, d = 1.2 – 3.3); One-legged Balance > Wall Plank & Chair (p < 0.001, d = 1.4 – 1.7). Average adductor JMOFs: Warrior II Trailing > Crescent Leading, Side Stretch Trailing, and Crescent Trailing (p < 0.001, d = 1.7 – 2.1).
Figure 8
Figure 8
Average Ankle JMOFs in the sagittal plane. The dashed line indicates the average peak ankle JMOFs generated during walking at a self-selected speed. The whiskers represent standard errors. Average plantar-flexor JMOFs: One-legged Balance > Wall Plank (p = 0.015, d = 0.9), Tree (p = 0.004, d = 0.9), & Side Stretch Trailing (p < 0.001, d = 1.9); Wall Plank > Side Stretch Trailing (p < 0.001, d = 1.6); Tree > Side Stretch Trailing (p = 0.002, d = 1.1).
Figure 9
Figure 9
Average Ankle JMOFs in the frontal plane. The dashed line indicates the average peak ankle JMOFs generated during walking at a self-selected speed. The whiskers represent standard errors. Average abductor JMOFs: Warrior II Trailing > Crescent Trailing (p = 0.032, d = 0.4). Average adductor JMOFs: One-legged Balance > Tree (p = 0.039, d = 0.4), Crescent Leading (p < 0.001, d = 1.6) & Side Stretch Leading (p < 0.001, d = 1.9); Tree > Crescent Leading & Side Stretch Leading (p < 0.001, d = 1.0 – 1.3).

Similar articles

Cited by

References

    1. Association NSG. Sports participation in 2010: lifecycle demographics. National Sporting Goods Association; 2011.
    1. Tummers N, Hendrick F. Older adults say yes to yoga. Nat Recreat Park Assoc. 2004;39:54–60.
    1. Wang MY, Yu SY, Hashish R, Samarawickrame S, Haines M, Mulwitz L, Kazadi L, Greendale GA, Salem GJ. Biomechanical demands of therapeutic Hatha yoga poses in older adults: modified chair and downward facing dog. Long Beach, CA; 2011. (Proceedings of the Annual meeting of American society of biomechanics). http://www.asbweb.org/conferences/2011/pdf/408.pdf.
    1. Schipplein OD, Andriacchi TP. Interaction between active and passive knee stabilizers during level walking. J Orthop Res. 1991;9:113–119. doi: 10.1002/jor.1100090114. - DOI - PubMed
    1. Miyazaki T, Wada M, Kawahara H, Sato M, Baba H, Shimada S. Dynamic load at baseline can predict radiographic disease progression in medial compartment knee osteoarthritis. Ann Rheum Dis. 2002;61:617–622. doi: 10.1136/ard.61.7.617. - DOI - PMC - PubMed

Publication types

Associated data