. 2013 Mar;87(6):3361-75.
doi: 10.1128/JVI.02368-12. Epub 2013 Jan 9.

CD22 is required for protection against West Nile virus Infection

Affiliations

CD22 is required for protection against West Nile virus Infection

Daphne Y Ma et al. J Virol. 2013 Mar.

Abstract

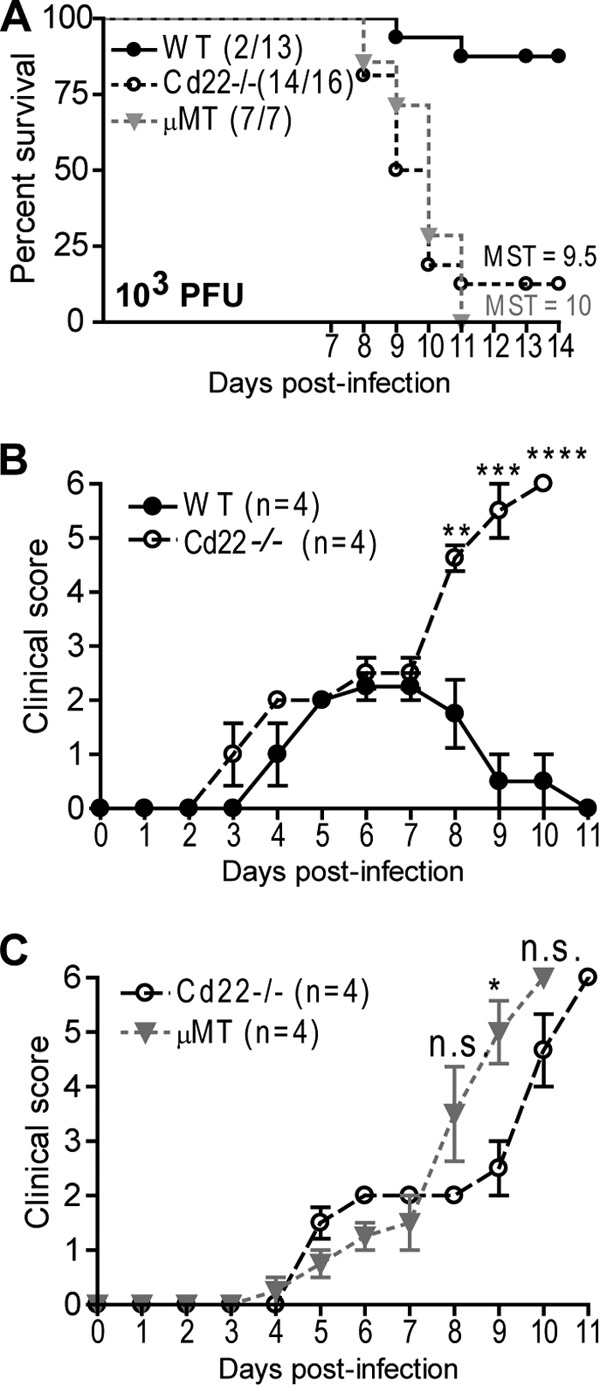
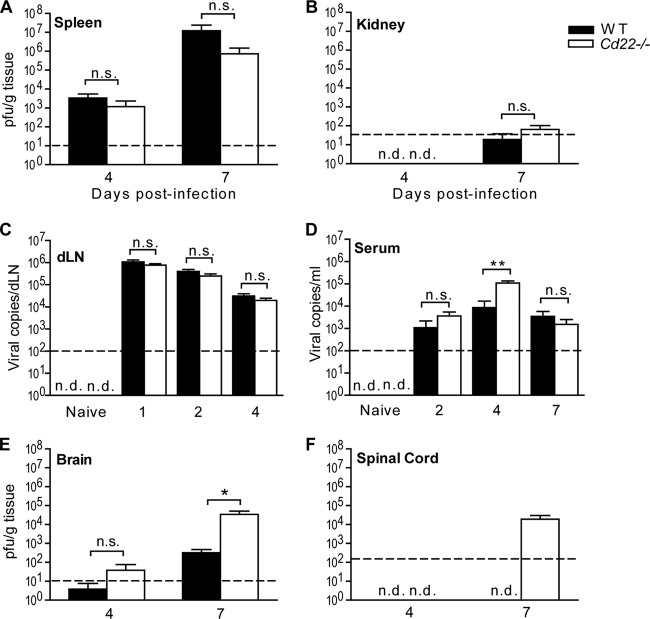
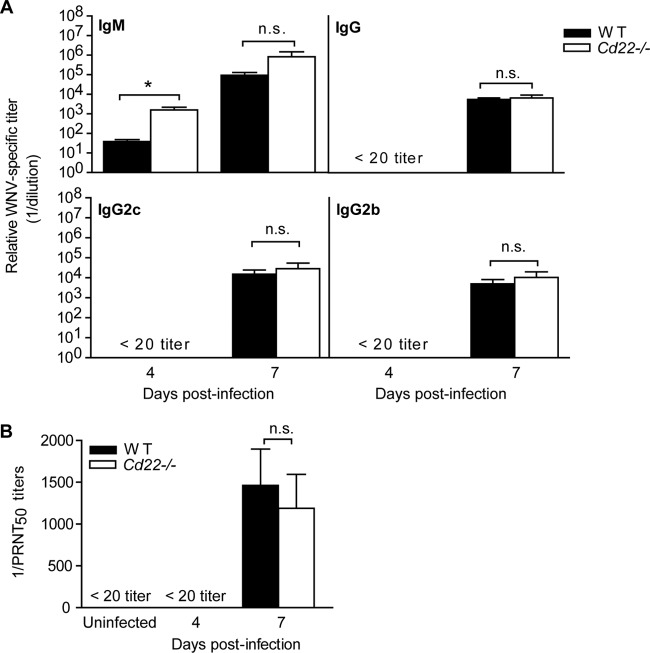
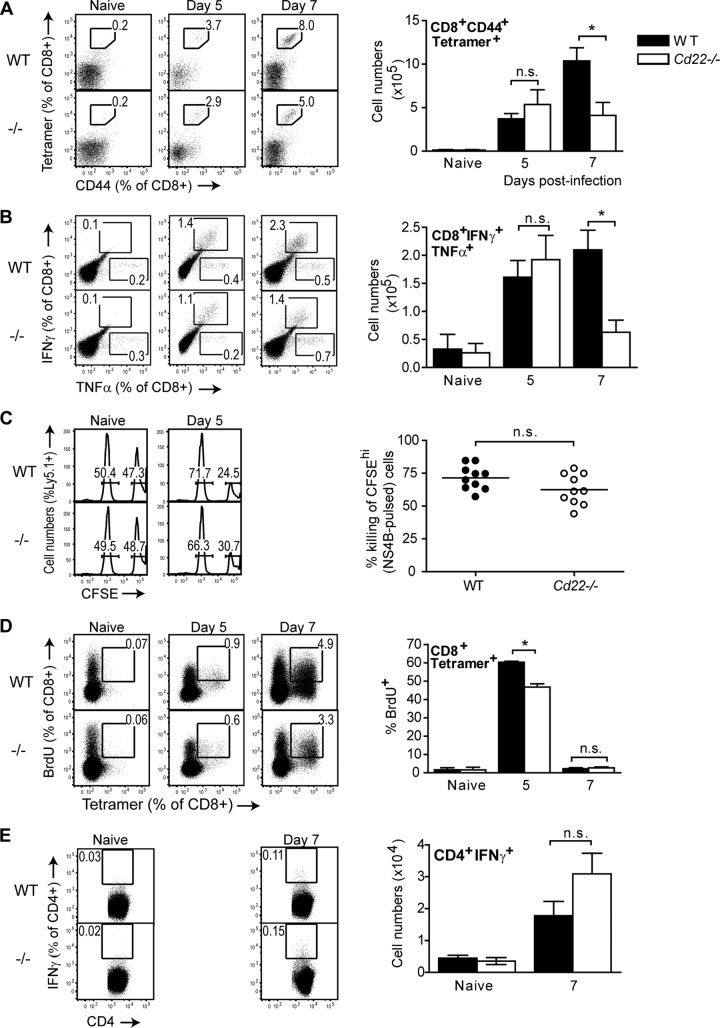
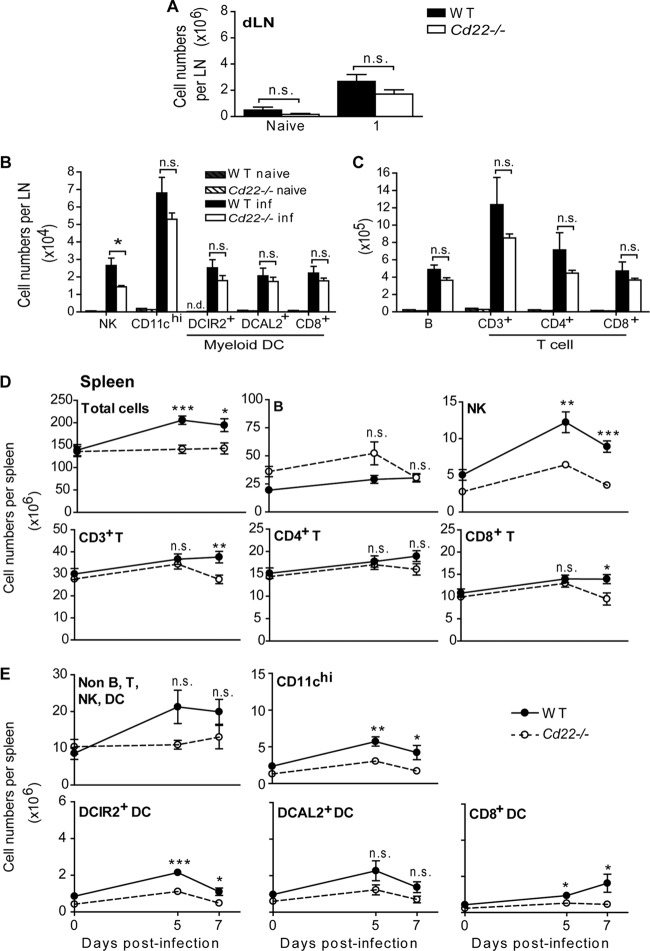
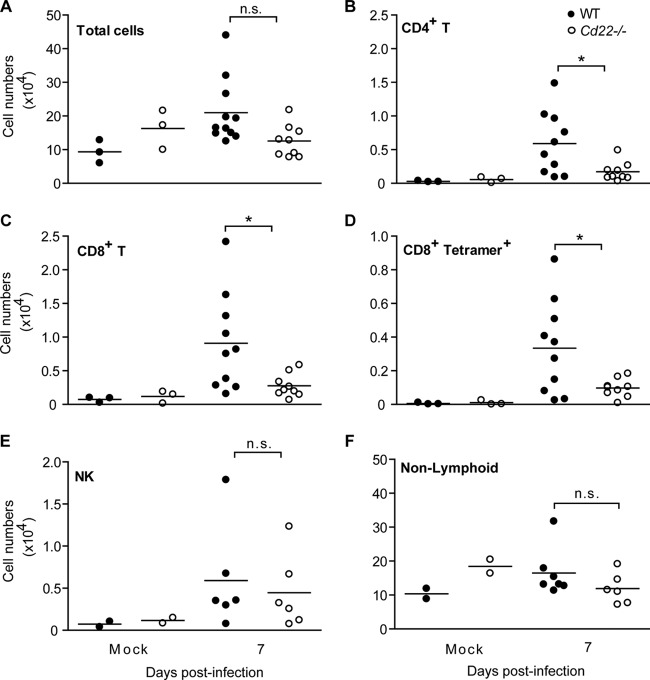
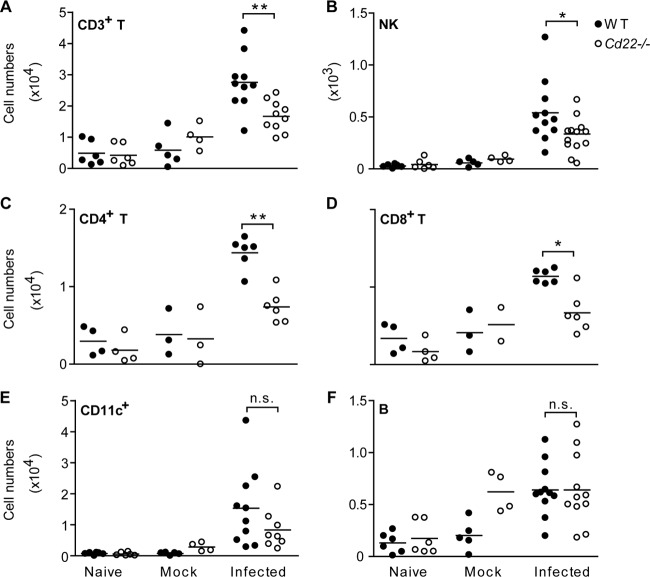
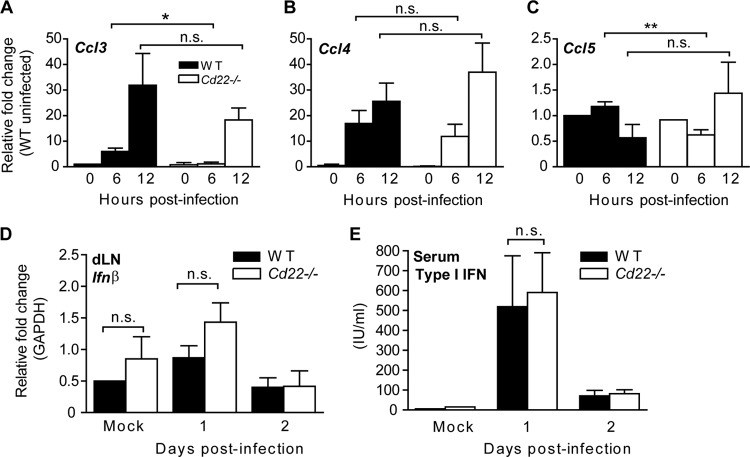
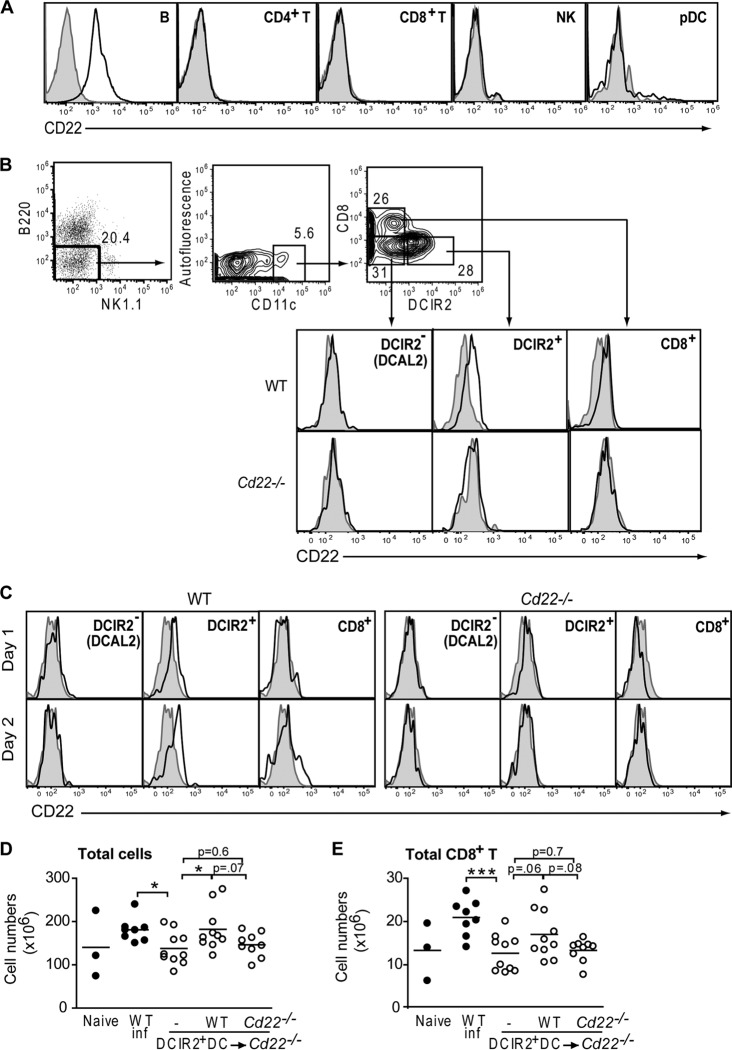
West Nile virus (WNV) is a RNA virus of the family Flaviviridae and the leading cause of mosquito-borne encephalitis in the United States. Humoral immunity is essential for protection against WNV infection; however, the requirements for initiating effective antibody responses against WNV infection are still unclear. CD22 (Siglec-2) is expressed on B cells and regulates B cell receptor signaling, cell survival, proliferation, and antibody production. In this study, we investigated how CD22 contributes to protection against WNV infection and found that CD22 knockout (Cd22(-/-)) mice were highly susceptible to WNV infection and had increased viral loads in the serum and central nervous system (CNS) compared to wild-type (WT) mice. This was not due to a defect in humoral immunity, as Cd22(-/-) mice had normal WNV-specific antibody responses. However, Cd22(-/-) mice had decreased WNV-specific CD8(+) T cell responses compared to those of WT mice. These defects were not simply due to reduced cytotoxic activity or increased cell death but, rather, were associated with decreased lymphocyte migration into the draining lymph nodes (dLNs) of infected Cd22(-/-) mice. Cd22(-/-) mice had reduced production of the chemokine CCL3 in the dLNs after infection, suggesting that CD22 affects chemotaxis via controlling chemokine production. CD22 was not restricted to B cells but was also expressed on a subset of splenic DCIR2(+) dendritic cells that rapidly expand early after WNV infection. Thus, CD22 plays an essential role in controlling WNV infection by governing cell migration and CD8(+) T cell responses.


Figures

Fig 1
Fig 1
Cd22−/− mice are more susceptible to WNV infection than WT mice. WT, Cd22−/−, and μMT mice were inoculated s.c. with 103 PFU of WNV-TX and monitored daily for survival (A) and morbidity (B and C). (A) Cd22−/− mice had a mean survival time (MST) of 9.5 days, and μMT mice had an MST of 10 days. Statistics were performed using a log rank test for significance, comparing the percentage of surviving WT mice to that of Cd22−/− mice (P < 0.0001). Numbers in parentheses indicate numbers of mice that succumbed out of total mice infected. (B and C) Clinical scores for mice inoculated s.c. with 103 PFU of WNV-TX (infected) are represented. Scoring is as follows: 1, ruffled fur, lethargy, hunched posture, no paresis; 2, very mild to mild paresis; 3, frank paresis involving at least one hind limb and/or conjunctivitis or mild paresis in two hind limbs; 4, severe paresis while still retaining feeling and possibly limbic; 5, true paralysis; and 6, moribund. Error bars represent variance of clinical scores. Statistics were performed using Student's t test to compare means of clinical scores at individual time points. *, P < 0.05; **, P < 0.01; ***, P < 0.001; ****, P < 0.0001. n.s., not significant. Data show one representative of three independent experiments with four mice per group.
Fig 2
Fig 2
Increased viral titers in the CNS and serum of WNV-infected Cd22−/− mice. Viral titers were determined using a standard plaque assay (A, B, E, and F) or quantification using real-time qPCR (C and D). Mice were inoculated as described in the text and tissues harvested at the indicated days p.i. Graphs show PFU of virus plaqued per gram of tissue or copies of viral RNA. Dotted lines show limits of detection. Statistics were performed using a Mann-Whitney U test of the median. *, P < 0.05; **, P < 0.01. n.s., not significant; n.d., not detected. Data are shown for 6 to 10 mice per time point per group.
Fig 3
Fig 3
Virus-specific antibody responses in WNV-infected Cd22−/− mice. (A) WNV E-protein-specific sandwich ELISAs were performed on serum samples from infected WT or Cd22−/− mice. Each symbol shows relative titers of antigen-specific antibody from an individual mouse. Data show samples of mice from three independent infections, where n > 9 individual mice for IgM and total IgG and n = 5 to 9 for IgG subclasses. (B) PRNT assays were used to quantify antibody titers with 50% virus neutralizing capacity (expressed as 1/PRNT50). Data show one out of three independent infections with at least four mice per group per time point. Statistics were performed using Student's t test. *, P < 0.05. n.s., not significant.
Fig 4
Fig 4
Impaired WNV-specific CD8+ T cell responses in the spleens of infected Cd22−/− mice. Splenocytes were harvested from naive or infected WT or Cd22−/− mice at various time points after infection. (A) Tetramer staining. Total splenocytes were stained with surface markers for CD8+ T cells, NS4B-specific MHC I tetramer, and CD44. Tetramer+ CD44+ CD8+ T cells are quantified in representative dot plots as frequency of CD8+ cells (left dot plots) or in cell numbers (right bar graph). (B) CD8+ T cell ICS. Total splenocytes were restimulated ex vivo with 1 μM NS4B peptide as described in Materials and Methods. Data are shown as IFN-γ+ TNF-α+ cells as a frequency of total CD8+ T cells (left dot plots) and total cell numbers of CD8+ IFN-γ+ TNF-α+ populations (right bar graphs). (C) In vivo cytotoxicity assays were performed at described in Materials and Methods. CFSE-labeled unpulsed (CFSE-low) and NS4B-pulsed (CFSE-high) Ly5.1+ splenocytes were transferred into naive WT or Cd22−/− mice or into WT or Cd22−/− mice infected 5 days earlier with WNV; 2 h later, splenocytes were isolated and stained for surface Ly5.1 expression. (Left histograms) Representative histograms show CFSE-low and -high populations as a frequency of total Ly5.1+ cells. (Right graph) Each symbol represents percent killing of NS4B-pulsed Ly5.1+ target cells in an infected WT or Cd22−/− mouse. (D) In vivo BrdU incorporation assay. Naive and day 5 and 7 infected WT and Cd22−/− mice were injected with BrdU i.p. as described in Materials and Methods. Data are shown as BrdU+ tetramer+ cells as a frequency of total CD8+ T cells (left dot plots) and frequency of CD8+ tetramer+ cells that are BrdU+ (right bar graphs). (E) CD4+ T cell ICS. Total splenocytes were restimulated ex vivo with overnight with 1 μM NS3 peptide prior to ICS to detect IFN-γ in CD4+ T cells. Data are shown as IFN-γ+ cells as a frequency of total CD4+ T cells (left dot plots) and cell numbers of CD4+ IFN-γ+ populations (right bar graphs). Data show one representative of three independent experiments with at least three mice per group per time point. Statistics were performed using Student's t test. *, P < 0.05. n.s., not significant.
Fig 5
Fig 5
CD8+ T cells, NK cells, and myeloid DC populations are decreased in the dLNs and spleens of WNV-infected Cd22−/− mice. Pooled popliteal dLNs (A, B, and C) and spleens (D and E) were harvested from naive mice or mice infected with 103 PFU of WNV-TX at the indicated days p.i. Total cells were stained for the indicated leukocyte populations. Total cell numbers for various populations are shown per dLN 1 day postinfection (A, B, and C) or per spleen (D and E) at the indicated time points. Statistics was performed using Student's t test. *, P < 0.05; **, P < 0.01; ***, P < 0.001. n.s., not significant; n.d., not detected. Data show one representative of 3 independent experiments with three mice per group per time point (dLNs) or mice from three independent experiments where n > 9 per group per time point (spleen).
Fig 6
Fig 6
Decreased T cell infiltrates into the brains of WNV-infected Cd22−/− mice. Mice were inoculated s.c. with WNV-TX and perfused with PBS on day 7 p.i. Brains were harvested, and lymphocytes were isolated as described in the text. Cells were enumerated after flow cytometry analysis for total leukocytes (A), total CD4+ T cells (B), total CD8+ T cells (C), CD8+ tetramer+ T cells (D), total NK cells (E), and nonlymphoid cells (CD19 CD3 NK1.1) (F). Symbols indicate individual mice from at least three independent experiments. Statistics were performed using Student's t test. *, P < 0.05. n.s., not significant.
Fig 7
Fig 7
Impaired recruitment of T cells and NK cells into infected dLNs in Cd22−/− mice. Ly5.1+ total splenocytes from WT C57BL/6 mice were adoptively transferred by i.v. injection into Ly5.2+ WT or Cd22−/− mice. The next day, individual footpads of recipient mice were left uninjected (naive), injected with 10 μl of a 1% FCS-containing HBSS vehicle (mock), or injected with 103 PFU of WNV-TX (infected). Twenty-four hours p.i., individual dLNs were harvested and processed separately before staining for the following populations: CD3+ T cells (A), NK cells (B), total CD4+ T cells (C), total CD8+ T cells (D), CD11chi DCs (E), and B cells (F). Symbols represent individual dLNs from mice from three independent experiments. Statistics were performed using a Mann-Whitney U test of the median. *, P < 0.05; **, P < 0.01. n.s., not significant.
Fig 8
Fig 8
CD22 expression regulates production of specific chemokines early in the WNV-infected dLNs. (A to D) Mice were inoculated and dLNs were harvested at indicated time points p.i. Relative expression levels of the indicated genes were quantified and graphed as fold change using TaqMan (A, B, and C) or Sybr green (D) as described in Materials and Methods. Data show one representative of three independent experiments with at least two mice per group per time point. (E) Mice were inoculated and serum samples taken at the indicated time points. Type I IFN production was quantified from serum samples using a standard bioassay. Data are represented as international units (IU) per ml of serum. Data show one representative of two independent experiments with three mice per group per time point. Statistics were performed using Student's t test. *, P < 0.05; **, P < 0.01. n.s., not significant.
Fig 9
Fig 9
DCIR2+ DCs express CD22. Shown is flow cytometry analysis of CD22 expression on splenic populations in WT C57BL/6 and Cd22−/− mice. Histograms show staining with anti-mouse CD22 antibody (bold) or isotype control antibody (shaded) and are representative of one of four independent experiments with at least 3 mice per group. (A) Spleen cells were isolated from naive WT C57BL/6 mice, and the indicated cell types were stained for CD22 expression. (B) Dot and contour flow plots show the gating scheme for myeloid DC subsets: B220 NK1.1 CD11chi populations were subdivided into DCIR2+, DCIR2 (DCAL2+), and CD8α+ DCs and analyzed for expression of CD22. (C) Cells from popliteal dLNs of infected WT and Cd22−/− mice were stained for CD22 expression on days 1 and 2 p.i. (D and E) Sorted DCIR2+ DCs from WT and Cd22−/− mice were adoptively transferred into naive Cd22−/− recipient groups i.v. Cd22−/− mice that received no DCs (−), WT DCs, or Cd22−/− DCs were inoculated with 103 PFU of WNV-TX and spleens harvested 7 days p.i. Numbers of total splenocytes (D) and total CD8+ T cells (E) are graphed. Each symbol shows an individual mouse from three independent experiments. Statistics were performed using Student's t test, with some P values reported. *, P < 0.05; ***, P < 0.001. n.s., not significant.

Similar articles

Cited by

References

    1. Samuel MA, Diamond MS. 2006. Pathogenesis of West Nile virus infection: a balance between virulence, innate and adaptive immunity, and viral evasion. J. Virol. 80:9349–9360 - PMC - PubMed
    1. Diamond MS, Shrestha B, Marri A, Mahan D, Engle M. 2003. B cells and antibody play critical roles in the immediate defense of disseminated infection by West Nile encephalitis virus. J. Virol. 77:2578–2586 - PMC - PubMed
    1. Diamond MS, Sitati EM, Friend LD, Higgs S, Shrestha B, Engle M. 2003. A critical role for induced IgM in the protection against West Nile virus infection. J. Exp. Med. 198:1853–1862 - PMC - PubMed
    1. Engle MJ, Diamond MS. 2003. Antibody prophylaxis and therapy against West Nile virus infection in wild-type and immunodeficient mice. J. Virol. 77:12941–12949 - PMC - PubMed
    1. Dörken B, Moldenhauer G, Pezzutto A, Schwartz R, Feller A, Kiesel S, Nadler LM. 1986. HD39 (B3), a B lineage-restricted antigen whose cell surface expression is limited to resting and activated human B lymphocytes. J. Immunol. 136:4470–4479 - PubMed

Publication types

Substances