. 2013 Apr;38(5):895-906.
doi: 10.1038/npp.2012.260. Epub 2012 Dec 18.

fosB-null mice display impaired adult hippocampal neurogenesis and spontaneous epilepsy with depressive behavior

Affiliations

fosB-null mice display impaired adult hippocampal neurogenesis and spontaneous epilepsy with depressive behavior

Noriko Yutsudo et al. Neuropsychopharmacology. 2013 Apr.

Abstract

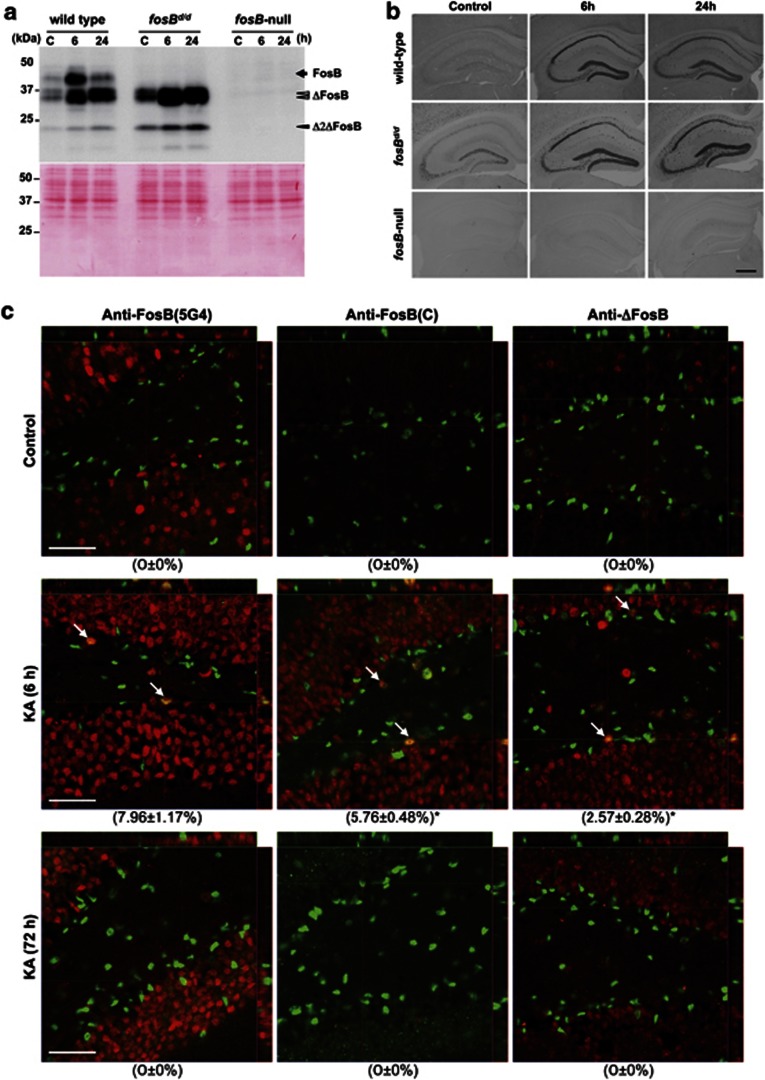
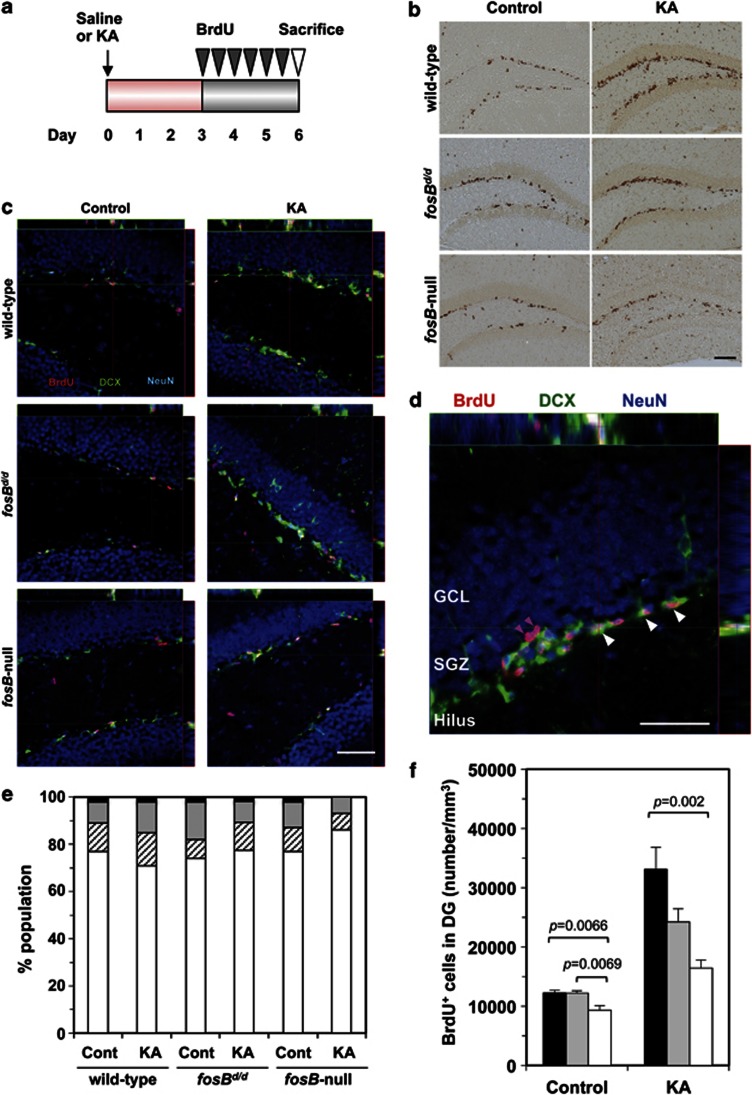
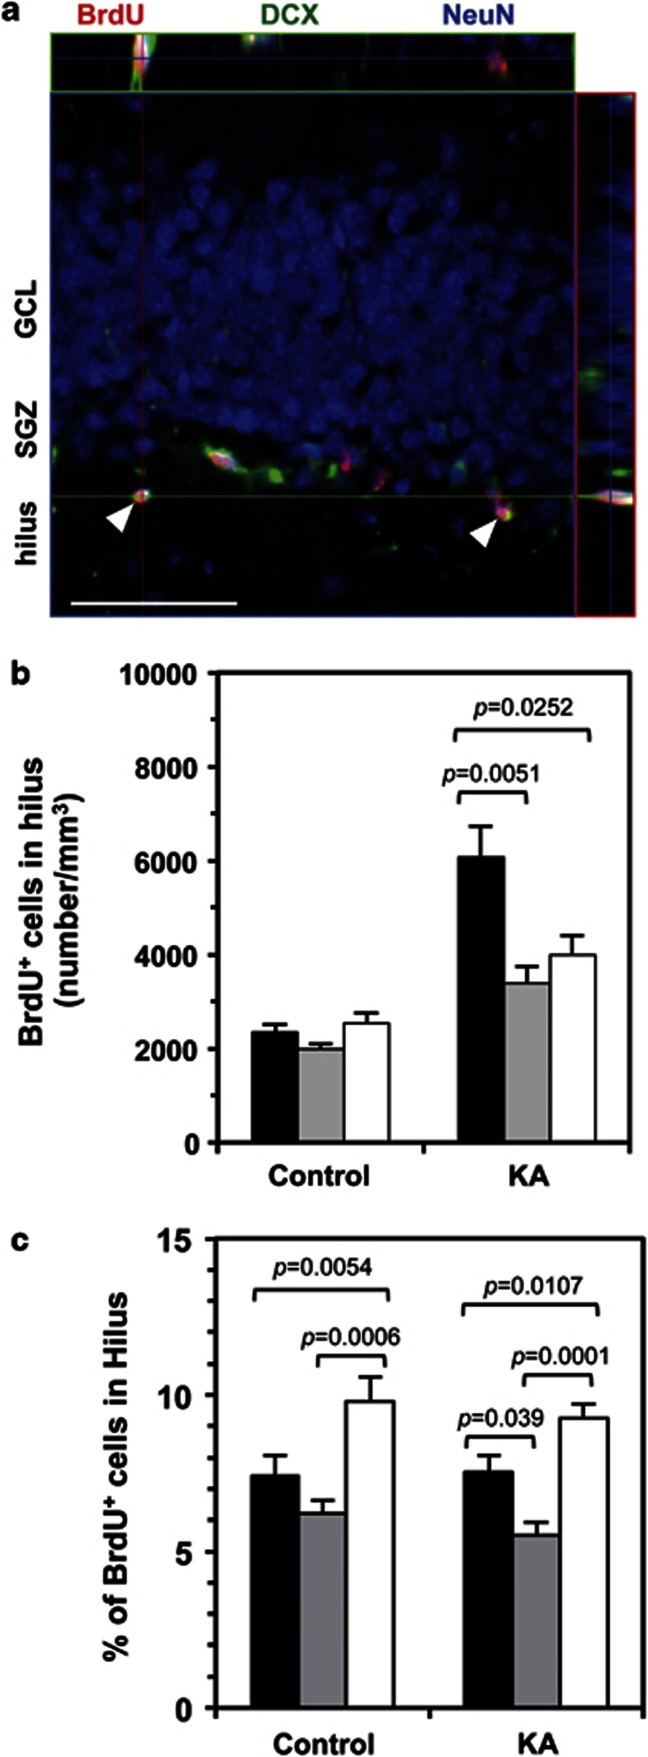
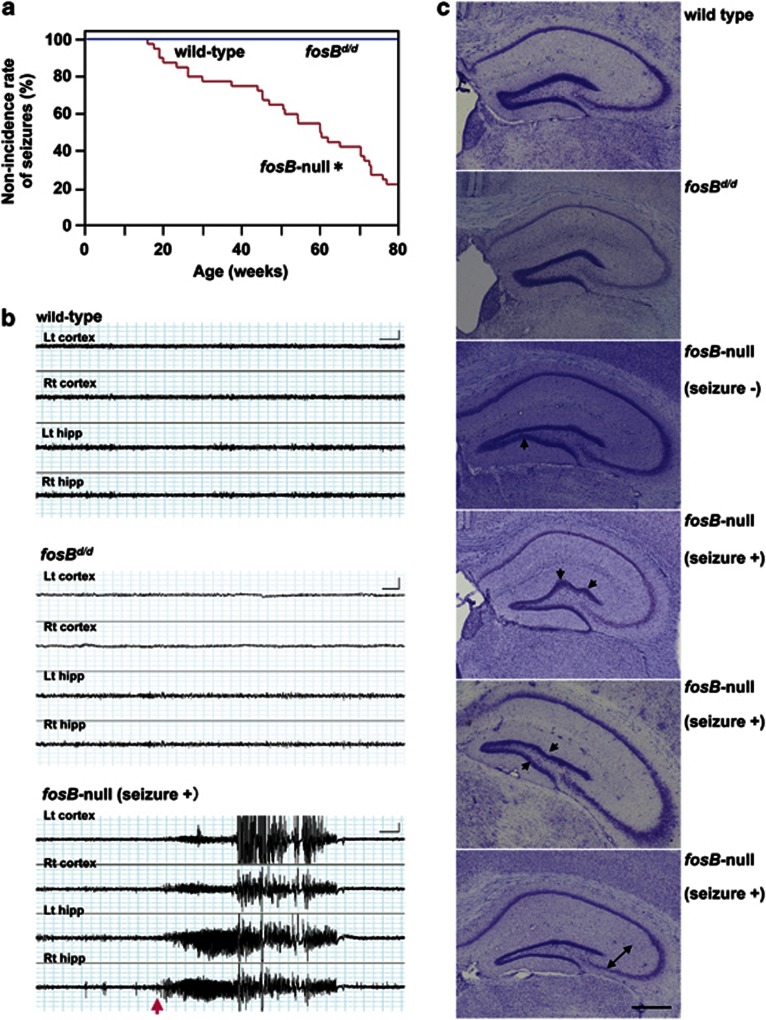
Patients with epilepsy are at high risk for major depression relative to the general population, and both disorders are associated with changes in adult hippocampal neurogenesis, although the mechanisms underlying disease onset remain unknown. The expression of fosB, an immediate early gene encoding FosB and ΔFosB/Δ2ΔFosB by alternative splicing and translation initiation, is known to be induced in neural progenitor cells within the subventricular zone of the lateral ventricles and subgranular zone of the hippocampus, following transient forebrain ischemia in the rat brain. Moreover, adenovirus-mediated expression of fosB gene products can promote neural stem cell proliferation. We recently found that fosB-null mice show increased depressive behavior, suggesting impaired neurogenesis in fosB-null mice. In the current study, we analyzed neurogenesis in the hippocampal dentate gyrus of fosB-null and fosB(d/d) mice that express ΔFosB/Δ2ΔFosB but not FosB, in comparison with wild-type mice, alongside neuropathology, behaviors, and gene expression profiles. fosB-null but not fosB(d/d) mice displayed impaired neurogenesis in the adult hippocampus and spontaneous epilepsy. Microarray analysis revealed that genes related to neurogenesis, depression, and epilepsy were altered in the hippocampus of fosB-null mice. Thus, we conclude that the fosB-null mouse is the first animal model to provide a genetic and molecular basis for the comorbidity between depression and epilepsy with abnormal neurogenesis, all of which are caused by loss of a single gene, fosB.


Figures

Figure 1
Figure 1
Wild-type, fosBd/d, and fosB-null mice showed differential expression of FosB, ΔFosB, and Δ2ΔFosB in the hippocampus. (a) Western blotting of fosB products in hippocampal nuclear extracts. Nuclear extracts (12.5 μg protein per lane) were prepared from hippocampi at indicated times after saline (C) or KA (6 h, 24 h) administration, and were subjected to western blotting with anti-FosB (5G4) (upper panel). fosB products are highlighted: black arrow (FosB), open arrowheads (ΔFosB), and closed arrowhead (Δ2ΔFosB). Blots were post-stained with Ponceau S (lower panel). Quantified results are shown in Supplementary Figure S1a. (b) Immunohistochemistry of fosB products at 0 h (control), 6 h, or 24 h after KA administration in the adult hippocampus of wild-type, fosBd/d, and fosB-null mice. Anti-FosB (N) was used to detect fosB products (FosB, ΔFosB, and Δ2ΔFosB). Scale bar: 500 μm. (c) Laser scanning confocal immunofluorescence microscopy of fosB products at 0 h (control), 6 h, or 72 h after KA administration in the DG of wild-type mice. Three different antibodies against fosB products, anti-FosB (5G4), anti-FosB (C), and anti-ΔFosB were used to detect fosB products (red). SOX2 protein (green), a marker for neural progenitor cells, was dominantly detected in SGZ of the DG. Arrows indicate cells expressing both fosB products and SOX2. Orthogonal projections throughout the cells are shown. Scale bars: 50 μm. Percentage of anti-FosB IR-positive cells in the SOX2-positive population is shown in parentheses with SEM. More than 100 SOX2-positive cells in each animal (N=3) were observed. *p=0.0421 (anti-FosB (C) IR vs anti-ΔFosB IR-positive population 6 h after KA administration, Fisher's exact test).
Figure 2
Figure 2
Adult fosB-null mice show reduced basal and KA-induced proliferation of neural progenitor cells in the hippocampus. (a) Experimental design. For 3 days following saline (control) or KA injection, mice were injected with BrdU twice daily. Brain sections were prepared on the 6th day, and BrdU-positive cells were detected. (b) Immunohistochemistry for BrdU in adult DG of wild-type, fosBd/d, and fosB-null mice, following saline (control) or KA injection. Scale bar: 200 μm. (c) Laser scanning confocal immunofluorescence microscopy for DCX (green) and NeuN (blue), both neuronal lineage markers, and BrdU (red). Scale bar: 50 μm. (d) Phenotype of BrdU-positive cells in the DG. Orthogonal projections throughout the cells are shown to demonstrate triple (BrdU+/DCX+/NeuN+ shown with white arrowheads) and double-labeled (BrdU+/NeuN+ shown with magenta arrowheads) cells. BrdU+ single-labeled or BrdU+/DCX+ double-labeled cells are not seen in this panel. Scale bar: 50 μm. (e) fosB products do not affect differentiation of newborn neurons. One hundred BrdU-positive cells, within immunofluorescence-stained sections from each animal, and two animals for each group, were examined by confocal microscopy to determine the phenotype of BrdU-positive cells. In all three genotypes, the majority of BrdU-positive cells express DCX and/or NeuN. Bar graphs show percentages of BrdU+/DCX/NeuN (black), BrdU+/DCX/NeuN+ (gray), BrdU+/DCX+/NeuN (hatched), and BrdU+/DCX+/NeuN+ (open) cells. (f) Density of BrdU-positive cells in the DG was determined. N=5 in each group; error bars, mean±SEM; black bars, wild type; gray bars, fosBd/d; open bars, fosB-null. One-way ANOVA (control, F2,12=9.56, p=0.0033; KA, F2,12=10.08, p=0.0027). The p-values (Tukey–Kramer HSD post hoc comparison) are shown.
Figure 3
Figure 3
Adult fosB-null mice show increased ectopic migration of neural progenitor cells in the hippocampus. As shown in Figure 2a, for 3 days following saline (control) or KA injection, mice were injected with BrdU twice daily. Brain sections were prepared on the sixth day, and BrdU-positive cells were detected. (a) Laser scanning confocal immunofluorescence microscopy for BrdU (red), DCX (green), and NeuN (blue) in the hilus of fosB-null mice. The arrowheads indicate ectopic neuroblasts or immature neurons (BrdU+/DCX+/NeuN+). Orthogonal projections throughout the cells are shown. Scale bar: 50 μm. (b) The density of BrdU-positive cells in the hilus. N=5 in each group; error bars, mean±SEM; black bars, wild type; gray bars, fosBd/d; open bars, fosB-null. One-way ANOVA (control: F2,12=2.53, p=0.121; KA: F2,12=8.58, p=0.0049). The p-values (Tukey–Kramer HSD post hoc comparison) are shown. (c) The percentage of BrdU-positive cells in the hilus, calculated from the total number of BrdU-positive cells in the entire DG. N=5 in each group; error bars, mean±SEM; black bars, wild-type; gray bars, fosBd/d; open bars, fosB-null. One-way ANOVA (control: F2,12=14.53, p=0.0006; KA: F2,12=20.17, p=0.0001). The p-values (Tukey–Kramer HSD post hoc comparison) are shown.
Figure 4
Figure 4
Aged fosB-null mice exhibit spontaneous seizures with epileptiform electroencephalograph discharges that originate in the hippocampus, and an abnormal DG structure. (a) The non-incidence rate of spontaneous seizures. Wild-type and fosBd/d mice, N=10; fosB-null mice, N=40. *p<0.0001, Kaplan–Meier method and log-rank test (χ2=40.94, df=2). (b) Concurrent hippocampal and cortical EEGs in 50- to 70-week wild-type (upper panel), fosBd/d (middle panel), and fosB-null mice (lower panel). Lt cortex, left cortex; Rt cortex, right cortex; Lt hipp, left hippocampus; Rt hipp, right hippocampus. N=5 in each group. Scale bars: X axis, 4 s; Y axis, 0.5 mV. (c) Nissl stained coronal hippocampal sections from wild-type, fosBd/d, and fosB-null mice. Characteristic abnormal arrangements (arrows) and thinning (bidirectional arrow) of the GCL are observed in fosB-null mice regardless of seizures. Seizure−, without any seizures; Seizure+, with seizures. Scale bar: 500 μm.

Similar articles

Cited by

References

    1. Abbosh C, Lawkowski A, Zaben M, Gray W. GalR2/3 mediates proliferative and trophic effects of galanin on postnatal hippocampal precursors. J Neurochem. 2011;117:425–436. - PubMed
    1. Anouar Y, Lee HW, Eiden LE. Both inducible and constitutive activator protein-1-like transcription factors are used for transcriptional activation of the galanin gene by different first and second messenger pathways. Mol Pharmacol. 1999;56:162–169. - PubMed
    1. Ben-Ari Y, Cossart R. Kainate, a double agent that generates seizures: two decades of progress. Trends Neurosci. 2000;23:580–587. - PubMed
    1. Benjamini Y, Hochberg Y. Controlling the false discovery rate: a practical and powerful approach to multiple testing. J R Stat Soc Series B Stat Methodol. 1995;57:289–300.
    1. Canu N, Possenti R, Rinaldi AM, Trani E, Levi A. Molecular cloning and characterization of the human VGF promoter region. J Neurochem. 1997;68:1390–1399. - PubMed

Publication types

MeSH terms