. 2013 May;38(6):1015-31.
doi: 10.1038/npp.2012.266. Epub 2013 Jan 2.

Enhanced histaminergic neurotransmission and sleep-wake alterations, a study in histamine H3-receptor knock-out mice

Affiliations

Enhanced histaminergic neurotransmission and sleep-wake alterations, a study in histamine H3-receptor knock-out mice

Elise Gondard et al. Neuropsychopharmacology. 2013 May.

Abstract

Long-term abolition of a brain arousal system impairs wakefulness (W), but little is known about the consequences of long-term enhancement. The brain histaminergic arousal system is under the negative control of H3-autoreceptors whose deletion results in permanent enhancement of histamine (HA) turnover. In order to determine the consequences of enhancement of the histaminergic system, we compared the cortical EEG and sleep-wake states of H3-receptor knockout (H3R-/-) and wild-type mouse littermates. We found that H3R-/-mice had rich phenotypes. On the one hand, they showed clear signs of enhanced HA neurotransmission and vigilance, i.e., a higher EEG θ power during spontaneous W and a greater extent of W or sleep restriction during behavioral tasks, including environmental change, locomotion, and motivation tests. On the other hand, during the baseline dark period, they displayed deficient W and signs of sleep deterioration, such as pronounced sleep fragmentation and reduced cortical slow activity during slow wave sleep (SWS), most likely due to a desensitization of postsynaptic histaminergic receptors as a result of constant HA release. Ciproxifan (H3-receptor inverse agonist) enhanced W in wild-type mice, but not in H3R-/-mice, indicating a functional deletion of H3-receptors, whereas triprolidine (postsynaptic H1-receptor antagonist) or α-fluoromethylhistidine (HA-synthesis inhibitor) caused a greater SWS increase in H3R-/- than in wild-type mice, consistent with enhanced HA neurotransmission. These sleep-wake characteristics and the obesity phenotypes previously reported in this animal model suggest that chronic enhancement of histaminergic neurotransmission eventually compromises the arousal system, leading to sleep-wake, behavioral, and metabolic disorders similar to those caused by voluntary sleep restriction in humans.


Figures

Figure 1
Figure 1
PCR genotyping of mouse tail DNA showing the presence of H3-receptor gene (361 bps) in the wild type (WT) mice (animals 1–15) and its absence (replaced by a 280 bps allele) in their knockout (KO) littermates (animals 16–30).
Figure 2
Figure 2
Comparison of spontaneous sleep-wake parameters in H3-receptor (H3R) +/+ and −/− littermates. H3R +/+, filled symbols and columns; H3R −/−, unfilled symbols and columns. a, Examples of polygraphic recordings and corresponding hypnograms showing the spontaneous sleep-wake cycle before and after lights-off. b, mean hourly values (± SEM in min) of the sleep-wake states. The gray areas correspond to the period between 7 and 11 p.m., and the total values for each sleep-wake state during this period are indicated in the bars with background situated in the right side of each figure. The left side non-background inserted histograms correspond to the light/dark or dark/light (L/D or D/L) ratio of sleep-wake amount before and after lights-off. They were obtained by 8 h sleep-wake amounts before lights off, divided by those after lights-off or verse versa. c, Means±SEM (in min) of the sleep-wake stages for the 12 h light and dark and 24 h periods. d, mean values ±SEM of episode number and duration of each sleep-wake state during the darkness. Note that, compared with H3R +/+ mice, H3R −/− mice exhibited 1) a deficit of wakefulness (W) immediately after the lights-off (a), during darkness (a, b) and over 24 h (c) at the expense of slow wave sleep (SWS); 2) a pronounced sleep fragmentation during the darkness (a, d). Other abbreviations: PS, Paradoxical Sleep; EEG, electroencephalogram; EMG, electromyogram. n=30, corresponding to 2 × 24 h recordings for 15 animals of each genotype. °p>0.05, *p<0.05, **p<0.01, ***p<0.001, two way ANOVA for repeated measures (b except for the bar graphics) and unpaired Student's t-test (c, d and bar graphics in b, two-tails).
Figure 3
Figure 3
Mean spectral distribution of cortical EEG power density in baseline sleep-wake states in H3R +/+ and H3R −/− mice. The data were obtained from 16 samples of 8 pairs of littermates by pooling consecutive 4 s epochs during the period of 7–10 p.m. (darkness) using the fast Fourier transform routine within the frequency range of 0.5–60 Hz. a–b, Mean percentage power values in each 0.4 Hz frequency bin. Note the state-dependent profiles of cortical EEG spectra across wakefulness (W), slow wave sleep (SWS), and paradoxical sleep (PS) in H3R +/+ (a) and H3R −/− (b) mice. c–e, Mean percentage of cortical EEG power spectrum density (curves) and cortical EEG power band density (bars) in H3R +/+ (black line or filled bars) and H3R −/− (gray line or unfilled bars) mice. Note that the H3 −/− mice show an increase in theta band (3.5–9 Hz) during W and a decrease in slow activity in 3.5–5.5 Hz range during SWS. f, Cortical EEG SWS/W and SWS/PS power ratio (0.5–60 Hz) in H3R +/+ (filled bars) and H3R −/− (unfilled bars) mice. *p<0.05, nonparametric Mann Whitney test (two tails).
Figure 4
Figure 4
Effects of an environmental change on the sleep-wake states in H3R +/+ and H3R −/− mice. a, examples of polygraphic recording and corresponding hypnograms showing the effects of an environmental change (6–10 p.m.) on cortical EEG, EMG and sleep-wake cycle. b, mean values (±SEM in min) of each sleep-wake stage during the 4 h stay in the new environment, compared with the own baseline values of each genotype. c, mean net sleep-wake changes (±SEM) during the test, relative to the baseline values of each genotype. Note 1) a significant increase in waking (W) and decrease in slow wave sleep (SWS) and paradoxical sleep (PS) in both genotypes compared with their own baseline values (b); 2) a larger increase in W and greater decrease in SWS and in PS in H3R−/− than in H3R +/+ mice (c). n=22 from 11 pairs of animals, °p>0.05, *p<0.05; **p<0.01; ***p<0.001, post hoc Bonferroni test after significance in two-way ANOVA for repeated measures for b and unpaired Student's t-test for c (two-tails).
Figure 5
Figure 5
Effects of a wheel test on the sleep-wake states in H3R +/+ and H3R −/− mice. a, Examples of polygraphic recording and corresponding hypnograms illustrating the effects of the wheel test (6–10 p.m.) on cortical EEG, EMG and sleep-wake cycle. b, effect of the wheel test on the locomotion (number of wheel turns). c, quantitative variations of the sleep-wake states. Mean values (±SEM in min) of each sleep-wake stage during their 4 h stay on the wheel, compared with the own baseline values of each genotype. d, mean net sleep-wake changes (±SEM) during the test, relative to the baseline values of each genotype. Note 1) non significant difference between genotypes in terms of locomotion on the wheels (b); 2) a significant increase in waking (W) and decrease in slow wave sleep (SWS) and paradoxical sleep (PS) in each genotype compared with its own baseline values (c); 3) a greater increase in W and larger decrease in SWS and PS in H3R −/− than in H3R +/+ mice (d), n=26 from 13 pairs of animals. °p>0.05, *p<0.05, **p<0.01, ***p<0.001, post hoc Bonferroni test after significance in two-way ANOVA for repeated measures for c and unpaired Student's t-test for b and d (two-tails).
Figure 6
Figure 6
Effects of a motivation test using palatable food on the sleep-wake states in H3R +/+ and H3R −/− mice. a, Examples of polygraphic recording and corresponding hypnograms showing the effects of the motivation test (2–6 p.m.) on the cortical EEG, EMG and sleep-wake cycle. b, mean values (±SEM in min) of each sleep-wake stage during the 4 h in which the palatable food was presence, compared with the own baseline values of each genotype. c, mean net sleep-wake changes (±SEM in min) during the text, relative to the baseline values of each genotype. Note 1) a significant increase in waking (W) and decrease in slow wave sleep (SWS) in both genotypes and a decrease in paradoxical sleep (PS) only in H3R −/− mice, compared with their own baseline values (a, b); 2) a markedly greater effects on all sleep-wake states in H3R−/− than in H3R+/+ mice (c). n=16 from 8 pairs of animals. °p>0.05, *p<0.05, **p<0.01, ***p<0.001, post hoc Bonferroni test after significance in two-way ANOVA for repeated measures for b and unpaired Student's t-test for c (two-tails).
Figure 7
Figure 7
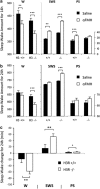
Effects of ciproxifan a H3-receptor inverse agonist, on the sleep-wake states in H3R +/+ and H3R −/− mice. a, Examples of polygraphic recording and corresponding hypnograms showing the effects of intraperitoneal injection of ciproxifan on cortical EEG and EMG and sleep-wake cycle. b, Mean values (±SEM in min) of each sleep-wake stage after saline or ciproxifan injection in both genotypes. c, mean net sleep-wake changes (±SEM in min) relative to the baseline values of each genotype. Note in H3R +/+ mice, but not in H3R −/−mice, that ciproxifan elicited a significant increase in waking (W) and decrease in slow wave sleep (SWS), n=10 for each genotype, °p>0.05, *p<0.05, **p<0.01, ***p<0.001, post hoc Bonferroni test after significance in two-way ANOVA for repeated measures for b and unpaired Student's t-test for c (two-tails).
Figure 8
Figure 8
Effects of triprolidine, a H1-receptor antagonist, on the sleep-wake states in H3R +/+ and H3R −/− mice. a, Examples of hypnograms showing the effects of intraperitoneal injection of triprolidine on the sleep-wake cycle. b, hourly cumulated increase in slow wave sleep (SWS) post triprolidine injection, relative to saline injection (baseline 0), comparison using post hoc Bonferroni test after significance in a two-way ANOVA for repeated measures c, mean net sleep-wake changes (±SEM in min) relative to the baseline values of each genotype obtained with saline injection, comparison using unpaired Student's t-test (two-tails). Note that tiprolidine induced an increase in SWS and decrease in W in both genotypes (a), but the effects are significantly greater in H3R−/− than in H3R+/+ mice in that 1) the SWS increase was evidenced each hour during 4 h in the KO mice instead of only the second hour in the WT mice (b); 2) there is a significant difference between genotypes in terms of W and SWS changes (c). n=14 for each genotype, °p>0.05; *p<0.05; **p<0.01 compared with values of saline injection in the same animals; αp<0.05 compared with values of H3 +/+ mice.
Figure 9
Figure 9
Effects of α-FMH, an inhibitor of histamine synthesis, on the sleep-wake states in H3R +/+ and H3R −/− mice. A,B, mean values (±SEM in min) of each sleep-wake stage during 14 h (a) or 24 h (b) after injection of saline or α-FMH (50 mg/kg, i.p., at 4 p.m.). c, mean net sleep-wake changes during 24 h post α-FMH injection (±SEM in min), relative to the baseline values of each genotype obtained with saline injection. Note that 1) α-FMH induced an increase in SWS and decrease in W in both genotypes during 14 h post injection (a, comparison using paired t-test, two-tails). The effects appear larger in H3R−/− mice than in H3R+/+ mice, but the difference is not yet statistically significant at this time parameter (a, two way ANOVA); 2) at 24 h post-injection (b), the difference becomes significant between genotypes: the decrease in W and increase in SWS remain significant in HR3−/− mice but not in H3R+/+ mice (b, post hoc Bonferroni tests after significance in two-way ANOVA for repeated measures) and that 3) there is a significant difference between genotypes in terms of the net changes of W and SWS (c, unpaired Student's t-test, two-tails). n=18 for each genotype, °p>0.05, *p<0.05, **p<0.01, ***p<0.001.
Figure 10
Figure 10
Schematic representation of our hypothesis on the consequences of H3-receptor deletion on histamine neurotransmission, sleep-wake states and metabolic outputs in H3-receptor knockout mice. Only presynaptic H3-autoreceptor is considered here. a, normal histamine (HA) neurotransmission promoting wake. Postsynaptic H1 and H2 receptors are responsible for the arousal effect of HA whereas presynaptic H3-receptors are involved by a negative feedback on HA neurons. b. Under baseline conditions, the constantly-enhanced HA neurotransmission in H3-receptor knockout mice would finally produce by homeostatic processes a decrease in HA neuronal activity and desensitization of H1 and H2 postsynaptic receptors, causing wake deficit, sleep deterioration and phenotypes of obesity. c. Facing behavioral challenges and consequently enhanced excitatory inputs, the absence of negative feedback results in an over activity of HA neurons which would overcome the postsynaptic defect, causing exaggerated wake responses and thus sleep restriction. Blue, black or red color signifies respectively normal, impaired or enhanced activity. down regulation; up regulation.

References

    1. Abe H, Honma S, Ohtsu H, Honma K. Circadian rhythms in behavior and clock gene expressions in the brain of mice lacking histidine decarboxylase. Brain Res Mol Brain Res. 2004;124:178–187. - PubMed
    1. Anaclet C, Parmentier R, Ouk K, Guidon G, Buda C, Sastre JP, et al. Orexin/hypocretin and histamine: distinct roles in the control of wakefulness demonstrated using knock-out mouse models. J Neurosci. 2009;29:14423–14438. - PMC - PubMed
    1. Arrang JM, Garbarg M, Schwartz JC. Auto-inhibition of brain histamine release mediated by a novel class (H3) of histamine receptor. Nature. 1983;302:832–837. - PubMed
    1. Barbier AJ, Berridge C, Dugovic C, Laposky AD, Wilson SJ, Boggs J, et al. Acute wake-promoting actions of JNJ-5207852, a novel, diamine-based H3 antagonist. Br J Pharmacol. 2004;143:649–661. - PMC - PubMed
    1. Bonaventure P, Letavic M, Dugovic C, Wilson S, Aluisio L, Pudiak C, et al. Histamine H3 receptor antagonists: from target identification to drug leads. Biochem Pharmacol. 2007;73:1084–1096. - PubMed

Publication types

LinkOut - more resources