. 2013 May;7(5):962-79.
doi: 10.1038/ismej.2012.161. Epub 2013 Jan 10.

Coral and macroalgal exudates vary in neutral sugar composition and differentially enrich reef bacterioplankton lineages

Affiliations

Coral and macroalgal exudates vary in neutral sugar composition and differentially enrich reef bacterioplankton lineages

Craig E Nelson et al. ISME J. 2013 May.

Abstract

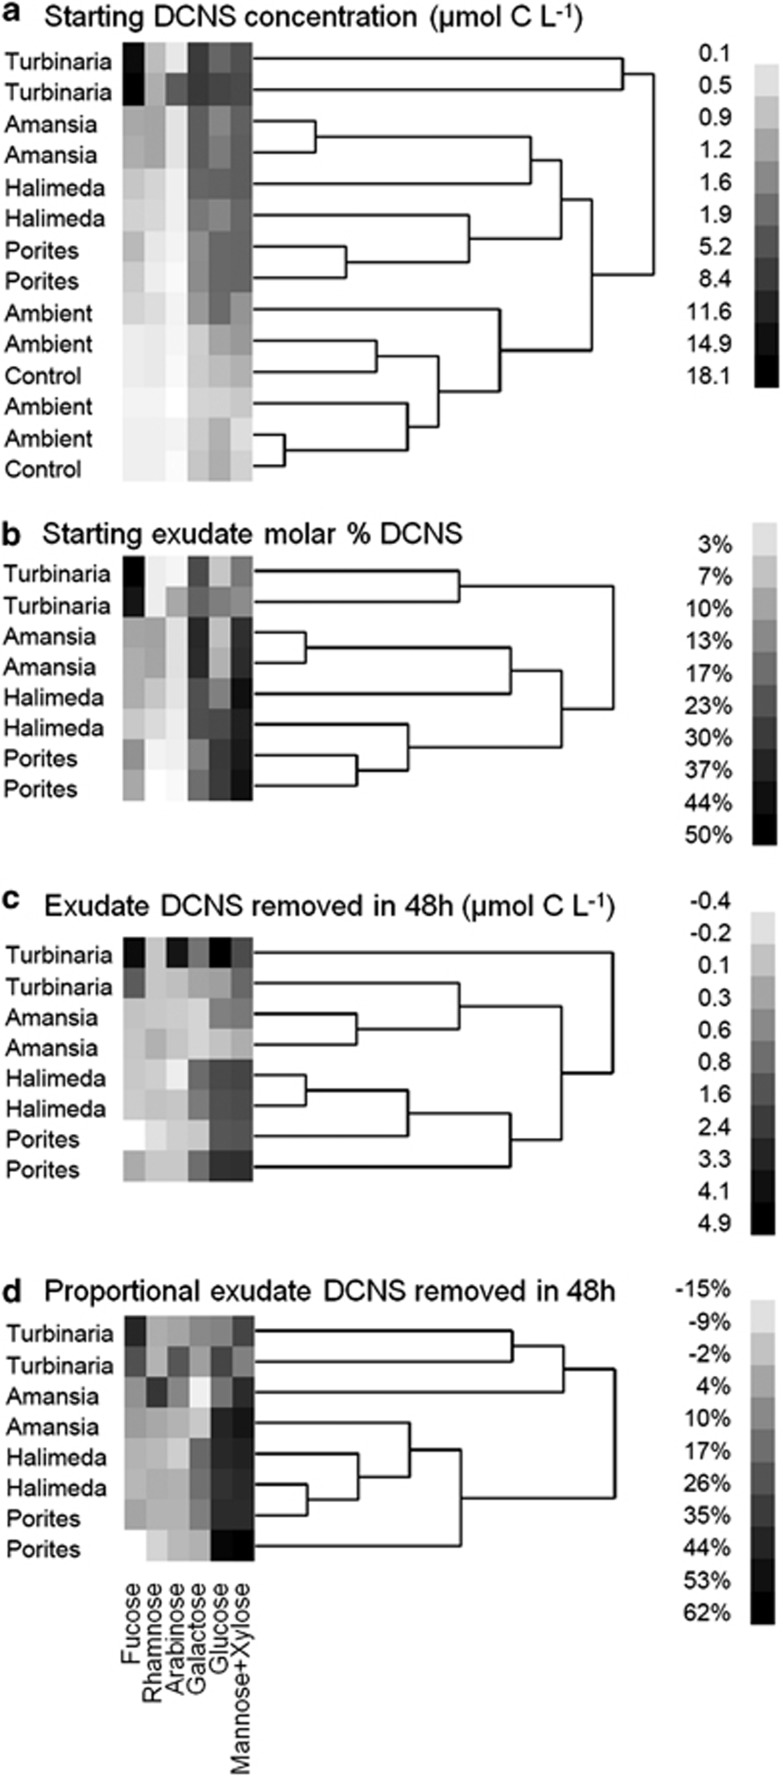
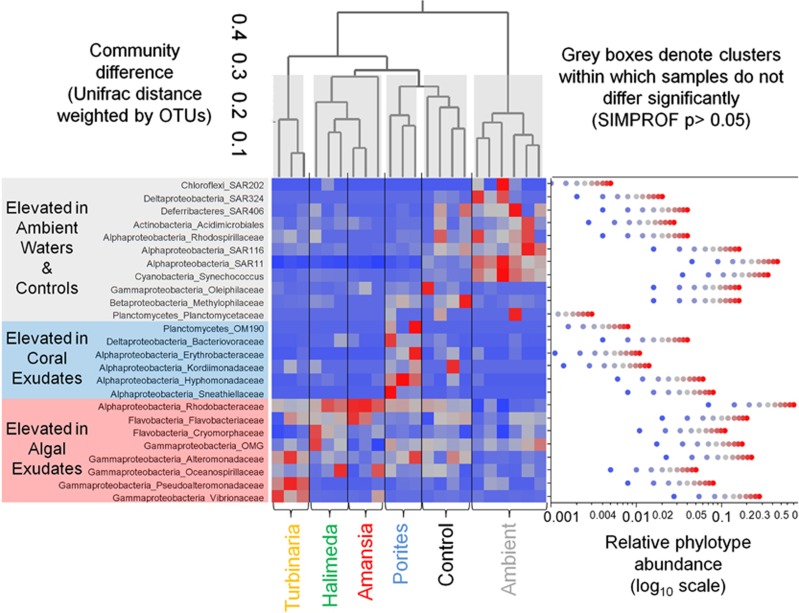
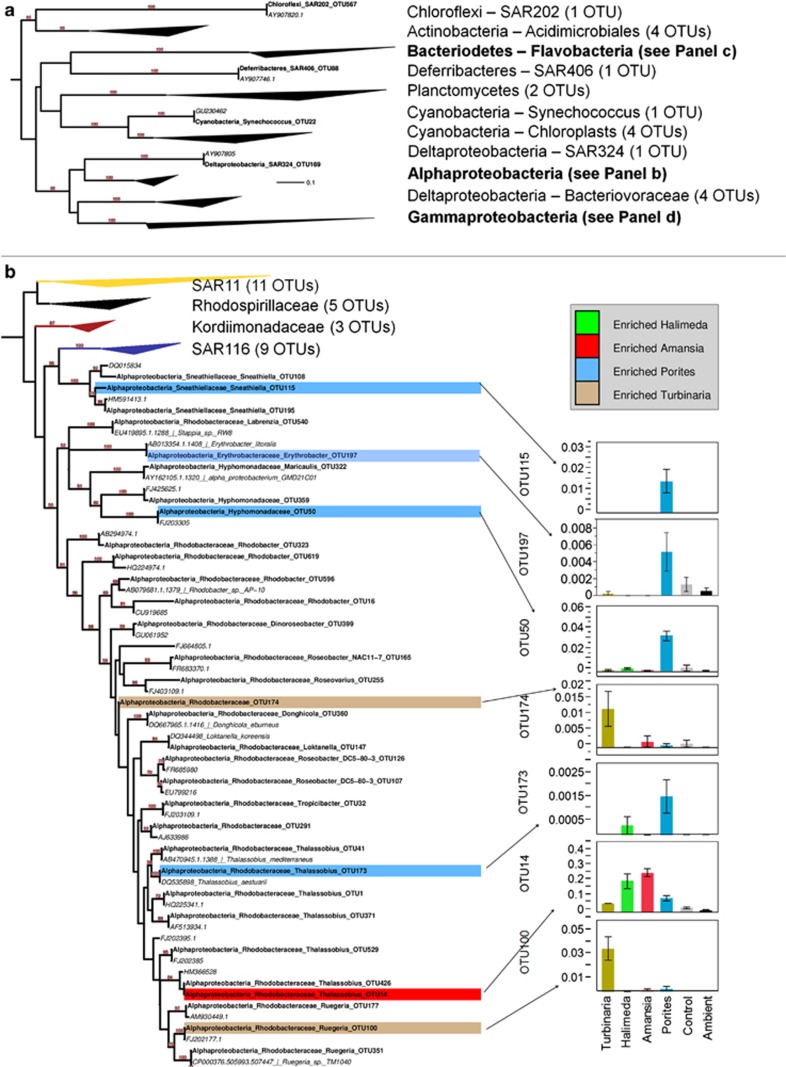
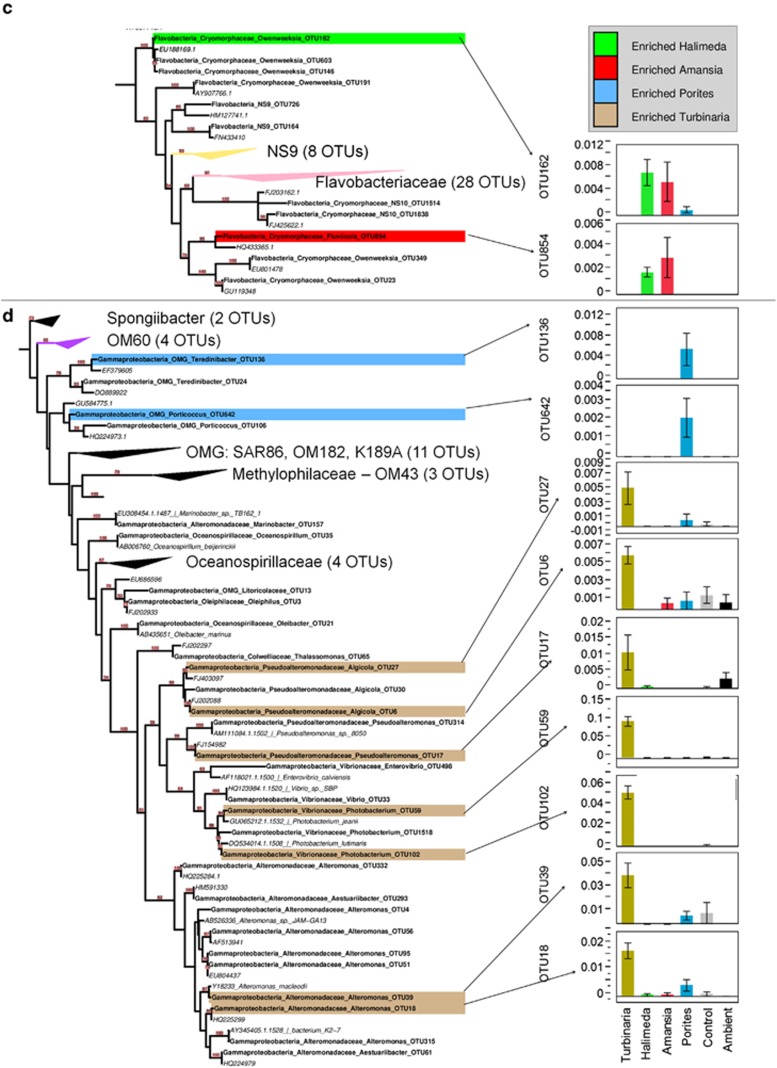
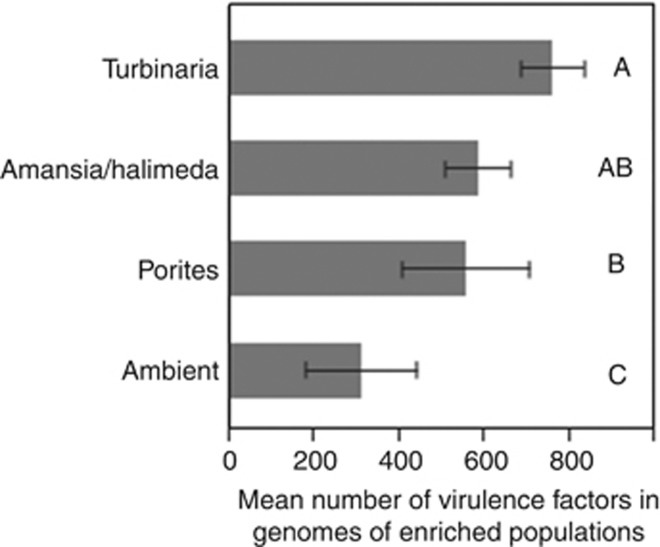
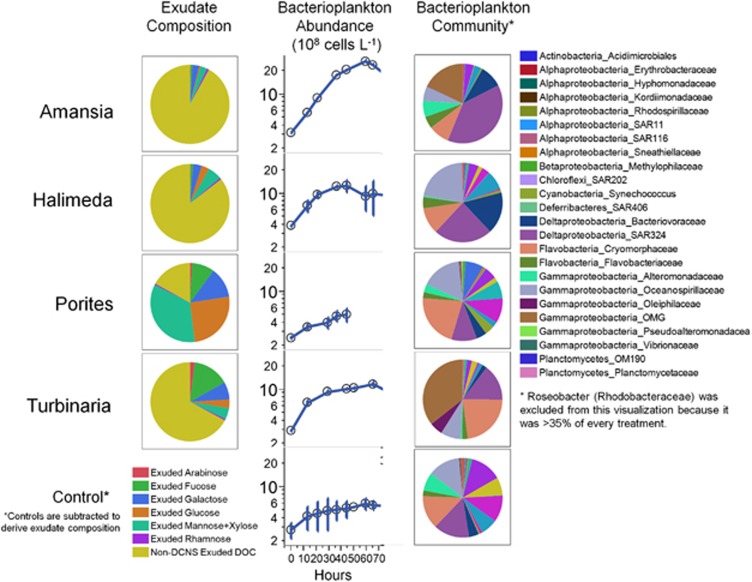
Increasing algal cover on tropical reefs worldwide may be maintained through feedbacks whereby algae outcompete coral by altering microbial activity. We hypothesized that algae and coral release compositionally distinct exudates that differentially alter bacterioplankton growth and community structure. We collected exudates from the dominant hermatypic coral holobiont Porites spp. and three dominant macroalgae (one each Ochrophyta, Rhodophyta and Chlorophyta) from reefs of Mo'orea, French Polynesia. We characterized exudates by measuring dissolved organic carbon (DOC) and fractional dissolved combined neutral sugars (DCNSs) and subsequently tracked bacterioplankton responses to each exudate over 48 h, assessing cellular growth, DOC/DCNS utilization and changes in taxonomic composition (via 16S rRNA amplicon pyrosequencing). Fleshy macroalgal exudates were enriched in the DCNS components fucose (Ochrophyta) and galactose (Rhodophyta); coral and calcareous algal exudates were enriched in total DCNS but in the same component proportions as ambient seawater. Rates of bacterioplankton growth and DOC utilization were significantly higher in algal exudate treatments than in coral exudate and control incubations with each community selectively removing different DCNS components. Coral exudates engendered the smallest shift in overall bacterioplankton community structure, maintained high diversity and enriched taxa from Alphaproteobacteria lineages containing cultured representatives with relatively few virulence factors (VFs) (Hyphomonadaceae and Erythrobacteraceae). In contrast, macroalgal exudates selected for less diverse communities heavily enriched in copiotrophic Gammaproteobacteria lineages containing cultured pathogens with increased VFs (Vibrionaceae and Pseudoalteromonadaceae). Our results demonstrate that algal exudates are enriched in DCNS components, foster rapid growth of bacterioplankton and select for bacterial populations with more potential VFs than coral exudates.


Figures

Figure 1
Figure 1
Starting composition and selective bacterial removal of each of the six neutral sugar hydrolysis products (DCNS) among coral and algal exudate treatments. Experimental treatments are average-neighbor clustered according to DCNS composition. (a) The starting concentration of each sugar component of DCNS among treatments and controls. (b) The mole % of each sugar in starting exudates after control correction. (c) The change in concentration of each sugar component of DCNS in exudates over 48 h after control correction. (d) The mole % of each sugar in the utilized portion of each exudate (that is, starting—remaining) after control correction. Note that exudates clustered according to source both in terms of absolute concentration (a) and in terms of relative contribution (b) at the start of the experiment, and all exudates were clearly distinct from control treatments and ambient reef water collected at the start of the experiment. Note also that utilization profiles of exudates by bacterioplankton differed according to treatment both in terms of absolute concentrations removed (c) and in terms of proportional removal of exuded DCNS components (d).
Figure 2
Figure 2
Heirarchical clustering of samples according to bacterial community similarity, with heatmap showing relative enrichment of family-level clades among samples. At top is an average-neighbor cluster dendrogram built from OTU-weighted Unifrac distances, with gray boxes surrounding samples that cluster and do not differ significantly (SIMPROF P>0.05). Note that communities in replicate incubations within treatments do not differ, whereas treatments differ significantly from each other and from controls and ambient water, except Halimeda and Amansia—amended communities that do not differ significantly. The adjacent heatmap shows relative abundance of each family-level clade in each sample. Heatmap data are standardized by clade to show relative enrichment among treatments; color-coding for relative abundance is shown in the right-hand plot for each clade. Mean relative abundance data and statistical comparisons are provided in Table 4.
Figure 3
Figure 3
Maximum-likelihood phylogeny of all OTUs analyzed in this study scaffolded with the nearest neighbors from the SILVA RefSeq database, with OTUs showing significant differences among treatments highlighted and mean relative abundances graphed. (a) A complete phylogeny is shown, with clades collapsed and annotated according to the number of OTUs found among all samples. (bd) Expansion phylogenies of the Alphaproteobacteria (b), Flavobacteria (c) and Gammaproteobacteria (d) are shown. OTUs identified by ANOVA and Dunnet's test as being significantly enriched in one of the exudate treatments relative to the controls are highlighted with a colored bar according to the treatment in which they were enriched. Arrows link each significant OTU with a graph comparing relative abundances among treatments (whiskers are 1 s.e. of the mean). OTUs from this study are in bold, whereas the nearest neighbors used for scaffolding the tree are listed in italics. Note that confidence values >60 (of 100 bootstraps) are annotated above branches. A scale bar showing evolutionary distance according to the generalised time-reversible (GTR) model is shown in (a). See Supplementary Information for a complete phylogeny (Supplementary Figure S3) and a table of statistical tests and mean relative abundances (Supplementary Table S5).
Figure 3
Figure 3
Maximum-likelihood phylogeny of all OTUs analyzed in this study scaffolded with the nearest neighbors from the SILVA RefSeq database, with OTUs showing significant differences among treatments highlighted and mean relative abundances graphed. (a) A complete phylogeny is shown, with clades collapsed and annotated according to the number of OTUs found among all samples. (bd) Expansion phylogenies of the Alphaproteobacteria (b), Flavobacteria (c) and Gammaproteobacteria (d) are shown. OTUs identified by ANOVA and Dunnet's test as being significantly enriched in one of the exudate treatments relative to the controls are highlighted with a colored bar according to the treatment in which they were enriched. Arrows link each significant OTU with a graph comparing relative abundances among treatments (whiskers are 1 s.e. of the mean). OTUs from this study are in bold, whereas the nearest neighbors used for scaffolding the tree are listed in italics. Note that confidence values >60 (of 100 bootstraps) are annotated above branches. A scale bar showing evolutionary distance according to the generalised time-reversible (GTR) model is shown in (a). See Supplementary Information for a complete phylogeny (Supplementary Figure S3) and a table of statistical tests and mean relative abundances (Supplementary Table S5).
Figure 4
Figure 4
Differences in mean number of VFs in OTUs enriched in each exudate treatment and ambient waters based on genomes of most closely related cultured isolates. Data are listed in Table 5; whiskers are one s.e. of the mean. Representative genomes ranged from 84% to 90% 16S sequence identity to OTUs, and statistical analysis is robust when a 90% minimum identity cutoff was applied. Note that Amansia and Halimeda exudates were combined to allow testing (n<3 each). Mean numbers of VFs in ambient waters are significantly lower than all three exudates, and Porites is significantly lower than Turbinaria (treatments with same letter are not significantly different, Tukey's post hoc test α=0.05).
Figure 5
Figure 5
Summary of differences in exudate composition, subsequent bacterioplankton growth and resulting bacterial community structure among the experimental treatments. Bacterioplankton abundances are means of replicate experiments ±1 s.d.

References

    1. Altschul SF, Gish W, Miller W, Myers EW, Lipman DJ. Basic local alignment search tool. J Mol Biol. 1990;215:403–410. - PubMed
    1. Aluwihare LI, Repeta DJ. A comparison of the chemical characteristics of oceanic DOM and extracellular DOM produced by marine algae. Mar Ecol Prog Ser. 1999;186:105–117.
    1. Ammerman JW, Fuhrman JA, Hagström Å, Azam F. Bacterioplankton growth in seawater: I. Growth kinetics and cellular characteristics in seawater cultures. Marine ecology progress series. Oldendorf. 1984;18:31–39.
    1. Amon RMW, Fitznar H-P, Benner R. Linkages among the bioreactivity, chemical composition, and diagenetic state of marine dissolved organic matter. Limnol Oceanogr. 2001;46:287–297.
    1. Anastasakis K, Ross AB, Jones JM. Pyrolysis behaviour of the main carbohydrates of brown macro-algae. Fuel. 2011;90:598–607.

Publication types

MeSH terms

LinkOut - more resources