

Differential regulation of HIF-mediated pathways increases mitochondrial metabolism and ATP production in hypoxic osteoclasts
- PMID: 23303559
- PMCID: PMC3618370
- DOI: 10.1002/path.4159
Differential regulation of HIF-mediated pathways increases mitochondrial metabolism and ATP production in hypoxic osteoclasts
Abstract
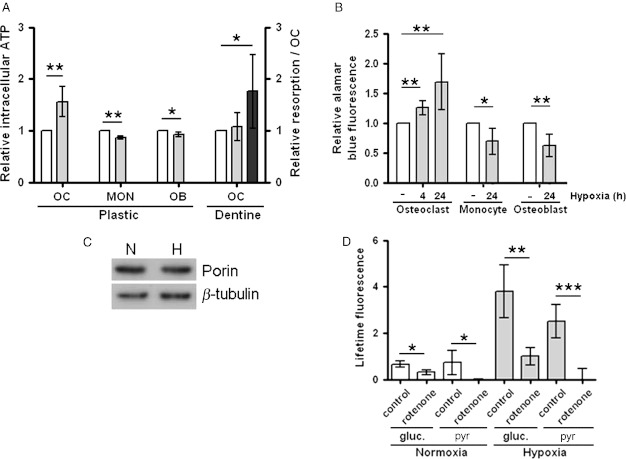
Inappropriate osteoclast activity instigates pathological bone loss in rheumatoid arthritis. We have investigated how osteoclasts generate sufficient ATP for the energy-intensive process of bone resorption in the hypoxic microenvironment associated with this rheumatic condition. We show that in human osteoclasts differentiated from CD14(+) monocytes, hypoxia (24 h, 2% O2 ): (a) increases ATP production and mitochondrial electron transport chain activity (Alamar blue, O2 consumption); (b) increases glycolytic flux (glucose consumption, lactate production); and (c) increases glutamine consumption. We demonstrate that glucose, rather than glutamine, is necessary for the hypoxic increase in ATP production and also for cell survival in hypoxia. Using siRNA targeting specific isoforms of the hypoxia-inducible transcription factor HIF (HIF-1α, HIF-2α), we show that employment of selected components of the HIF-1α-mediated metabolic switch to anaerobic respiration enables osteoclasts to rapidly increase ATP production in hypoxia, while at the same time compromising long-term survival. We propose this atypical HIF-driven metabolic pathway to be an adaptive mechanism to permit rapid bone resorption in the short term while ensuring curtailment of the process in the absence of re-oxygenation.
Copyright © 2013 Pathological Society of Great Britain and Ireland. Published by John Wiley & Sons, Ltd.
Figures


Similar articles
-
The Adenosine A2B Receptor Drives Osteoclast-Mediated Bone Resorption in Hypoxic Microenvironments.Cells. 2019 Jun 21;8(6):624. doi: 10.3390/cells8060624. Cells. 2019. PMID: 31234425 Free PMC article.
-
Distinct roles for the hypoxia-inducible transcription factors HIF-1α and HIF-2α in human osteoclast formation and function.Sci Rep. 2020 Dec 3;10(1):21072. doi: 10.1038/s41598-020-78003-z. Sci Rep. 2020. PMID: 33273561 Free PMC article.
-
Hypoxia-inducible factor is expressed in giant cell tumour of bone and mediates paracrine effects of hypoxia on monocyte-osteoclast differentiation via induction of VEGF.J Pathol. 2008 May;215(1):56-66. doi: 10.1002/path.2319. J Pathol. 2008. PMID: 18283716
-
Hypoxic regulation of osteoclast differentiation and bone resorption activity.Hypoxia (Auckl). 2015 Nov 11;3:73-82. doi: 10.2147/HP.S95960. eCollection 2015. Hypoxia (Auckl). 2015. PMID: 27774484 Free PMC article. Review.
-
Exploring the molecular interface between hypoxia-inducible factor signalling and mitochondria.Cell Mol Life Sci. 2019 May;76(9):1759-1777. doi: 10.1007/s00018-019-03039-y. Epub 2019 Feb 14. Cell Mol Life Sci. 2019. PMID: 30767037 Free PMC article. Review.
Cited by
-
Relationships between Slc1a5 and Osteoclastogenesis.Comp Med. 2021 Aug 1;71(4):285-294. doi: 10.30802/AALAS-CM-21-000012. Epub 2021 Jun 28. Comp Med. 2021. PMID: 34301346 Free PMC article.
-
Aglycemia keeps mitochondrial oxidative phosphorylation under hypoxic conditions in HepG2 cells.J Bioenerg Biomembr. 2015 Dec;47(6):467-76. doi: 10.1007/s10863-015-9628-6. Epub 2015 Oct 8. J Bioenerg Biomembr. 2015. PMID: 26449597
-
Metabolic reprogramming in osteoclasts.Semin Immunopathol. 2019 Sep;41(5):565-572. doi: 10.1007/s00281-019-00757-0. Epub 2019 Sep 24. Semin Immunopathol. 2019. PMID: 31552471 Free PMC article. Review.
-
Mitochondria as Key Players in the Pathogenesis and Treatment of Rheumatoid Arthritis.Front Immunol. 2021 Apr 29;12:673916. doi: 10.3389/fimmu.2021.673916. eCollection 2021. Front Immunol. 2021. PMID: 33995417 Free PMC article. Review.
-
Aluminum as a Possible Cause Toward Dyslipidemia.Indian J Occup Environ Med. 2023 Apr-Jun;27(2):112-119. doi: 10.4103/ijoem.ijoem_349_21. Epub 2023 Jul 3. Indian J Occup Environ Med. 2023. PMID: 37600652 Free PMC article. Review.
References
-
- Gough AK, Lilley J, Eyre S, et al. Generalised bone loss in patients with early rheumatoid arthritis. Lancet. 1994;344::23–27. - PubMed
-
- Francis MJ, Lees RL, Trujillo E, et al. ATPase pumps in osteoclasts and osteoblasts. Int J Biochem Cell Biol. 2002;34::459–476. - PubMed
-
- Teitelbaum SL, Ross FP. Genetic regulation of osteoclast development and function. Nat Rev Genet. 2003;4::638–649. - PubMed
-
- Treuhaft PS. DJ MC. Synovial fluid pH, lactate, oxygen and carbon dioxide partial pressure in various joint diseases. Arthritis Rheum. 1971;14::475–484. - PubMed
Publication types
MeSH terms
Substances
Grants and funding
LinkOut - more resources
Full Text Sources
Other Literature Sources
Research Materials
