. 2013 Jan 9;5(167):167ra6.
doi: 10.1126/scitranslmed.3004838.

Human cartilage repair with a photoreactive adhesive-hydrogel composite

Affiliations

Human cartilage repair with a photoreactive adhesive-hydrogel composite

Blanka Sharma et al. Sci Transl Med. .

Abstract

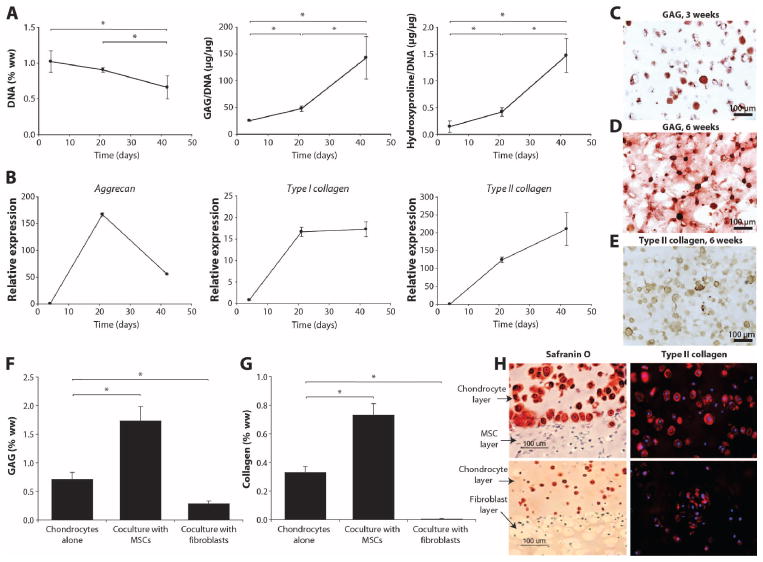
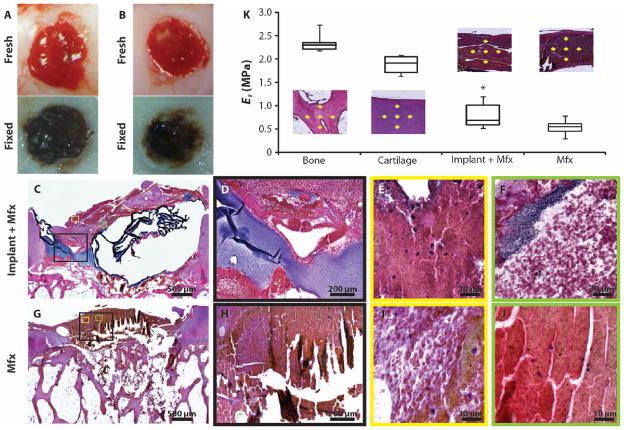
Surgical options for cartilage resurfacing may be significantly improved by advances and application of biomaterials that direct tissue repair. A poly(ethylene glycol) diacrylate (PEGDA) hydrogel was designed to support cartilage matrix production, with easy surgical application. A model in vitro system demonstrated deposition of cartilage-specific extracellular matrix in the hydrogel biomaterial and stimulation of adjacent cartilage tissue development by mesenchymal stem cells. For translation to the joint environment, a chondroitin sulfate adhesive was applied to covalently bond and adhere the hydrogel to cartilage and bone tissue in articular defects. After preclinical testing in a caprine model, a pilot clinical study was initiated where the biomaterials system was combined with standard microfracture surgery in 15 patients with focal cartilage defects on the medial femoral condyle. Control patients were treated with microfracture alone. Magnetic resonance imaging showed that treated patients achieved significantly higher levels of tissue fill compared to controls. Magnetic resonance spin-spin relaxation times (T(2)) showed decreasing water content and increased tissue organization over time. Treated patients had less pain compared with controls, whereas knee function [International Knee Documentation Committee (IKDC)] scores increased to similar levels between the groups over the 6 months evaluated. No major adverse events were observed over the study period. With further clinical testing, this practical biomaterials strategy has the potential to improve the treatment of articular cartilage defects.


Conflict of interest statement

Competing interests: Intellectual property related to the hydrogel and adhesive technology is owned by Johns Hopkins University (patent application nos. 20070098675, 20090324722, and 20100003329) and Biomet (patent application no. 7897165).

Figures

Fig. 1
Fig. 1
Clinical procedure for adhesive-hydrogel implantation into a cartilage defect. Both schematics and actual patient images are shown for the final steps. (A) A mini-incision approach was created to expose the cartilage defect. The defect edges were debrided to remove any dead tissue at the cartilage edge. (B) The adhesive was then applied to the base and walls of the defect followed by surgical microfracture. (C) Last, the hydrogel solution was injected into the defect and photopolymerized in situ with light. (D) Bleeding from the microfracture holes was trapped in and around the hydrogel.
Fig. 2
Fig. 2
In vitro cartilage growth in hydrogels. MSCs encapsulated in the PEG hydrogel underwent chondrogenesis and secreted cartilage matrix in culture. (A) DNA, GAG, and hydroxyproline contents were measured over 6 weeks. Data are presented as means ± SD; n = 4. *P < 0.05. (B) Expression of aggrecan, type II collagen, and type I collagen over 6 weeks. (C to E) Safranin-O staining for GAGs at 3 weeks (C) and 6 weeks (D) and type II collagen at 6 weeks (E) in MSC cultures. (F and G) GAG (F) and total collagen (G) production by chondrocytes cultured alone in hydrogel compared with chondrocytes in bilayer coculture with MSCs and fibroblasts in vitro. (H) Histological staining of cocultures. Safranin-O staining at the interface of the chondrocyte-MSC coculture layers and the control chondrocyte-fibroblast layers; type II collagen in chondrocyte layer of chondrocyte-MSC bilayer (top) compared with chondrocytes cultured alone (bottom).
Fig. 3
Fig. 3
Hydrogel implantation in conjunction with microfracture in a goat model. (A) Six hours after microfracture and hydrogel implantation, blood components are visible throughout the defect and hydrogel, which filled the defect to the level of the articular surface. Image is representative of n = 6. (B) Six hours after microfracture alone, blood clot fills the defect below the level of the articular defect. Image is representative of n = 6. (C to J) Hematoxylin and eosin (H&E) staining was performed to evaluate the morphology of defect contents in both groups. (D and H) Higher-magnification images of the areas boxed in black in (C) and (G), respectively. (E, F, I, and J) Higher-magnification images of the respective areas boxed in color in (C) and (G). (K) Nanoindentation mechanical testing was performed on the histological sections. Yellow crosses define where the mechanical testing was performed for representative sections. Data are standard median box plots (n = 3 sections per group with 10 to 15 indentations per represented area).
Fig. 4
Fig. 4
Imaging and clinical evaluation of cartilage repair. (A) MR images show tissue repair over 6 months after treatment with implant + microfracture (Mfx) or Mfx alone. Sample sagittal MR images are of the tibiofemoral joint acquired using T1-weighted (T1W), fat-suppressed gradient echo and proton density–weighted (PDW), fat-suppressed fast spin echo at baseline and at 6 months. Arrows highlight the defects. (B) Quantification of defect fill from MR images in (A), using both the fast spin-echo and gradient-echo images; the average of the two measurements was used. Data are means ± SD (n = 15 at baseline, n = 12 at 3 months, and n = 14 at 6 months). *P < 0.05 versus microfracture control. (C) T2 relaxation times measured from four regions of interest on two images (n = 8 for each patient). Data are means ± SD (n = 9 patients). *P < 0.05 versus respective baseline measurement.
Fig. 5
Fig. 5
Patient self-evaluated clinical outcomes. (A to C) Patients evaluated their frequency of pain (A), severity of pain (B), and IKDC scores (knee function) (C) over 6 months. For the implant + microfracture (Mfx) group (n = 15), the box represents values between the 25th and 75th percentiles, the line indicates median value, and the whiskers are the 10th and 90th percentiles. For the Mfx group (n = 3), the box bounds the upper and lower data points, with the line representing the median value. *P < 0.05 compared to baseline value.

Comment in

References

    1. Knutsen G, Drogset JO, Engebretsen L, Grøntvedt T, Isaksen V, Ludvigsen TC, Roberts S, Solheim E, Strand T, Johansen O. A randomized trial comparing autologous chondrocyte implantation with microfracture. Findings at five years. J Bone Joint Surg Am. 2007;89:2105–2112. - PubMed
    1. Van Assche D, Staes F, Van Caspel D, Vanlauwe J, Bellemans J, Saris DB, Luyten FP. Autologous chondrocyte implantation versus microfracture for knee cartilage injury: A prospective randomized trial, with 2-year follow-up. Knee Surg Sports Traumatol Arthrosc. 2010;18:486–495. - PubMed
    1. Hunziker EB. Articular cartilage repair: Basic science and clinical progress. A review of the current status and prospects. Osteoarthritis Cartilage. 2002;10:432–463. - PubMed
    1. Custers RJ, Saris DB, Dhert WJ, Verbout AJ, van Rijen MH, Mastbergen SC, Lafeber FP, Creemers LB. Articular cartilage degeneration following the treatment of focal cartilage defects with ceramic metal implants and compared with microfracture. J Bone Joint Surg Am. 2009;91:900–910. - PubMed
    1. Mithoefer K, McAdams T, Williams RJ, Kreuz PC, Mandelbaum BR. Clinical efficacy of the microfracture technique for articular cartilage repair in the knee: An evidence-based systematic analysis. Am J Sports Med. 2009;37:2053–2063. - PubMed

Publication types