Review
. 2013 Jul;26(7):810-28.
doi: 10.1002/nbm.2899. Epub 2013 Jan 10.

Nuts and bolts of chemical exchange saturation transfer MRI

Affiliations
Review

Nuts and bolts of chemical exchange saturation transfer MRI

Guanshu Liu et al. NMR Biomed. 2013 Jul.

Abstract

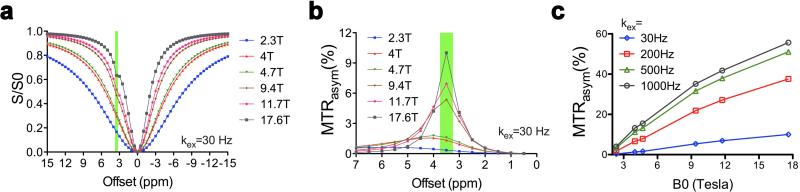
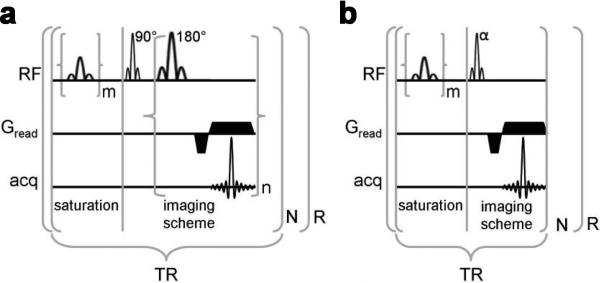
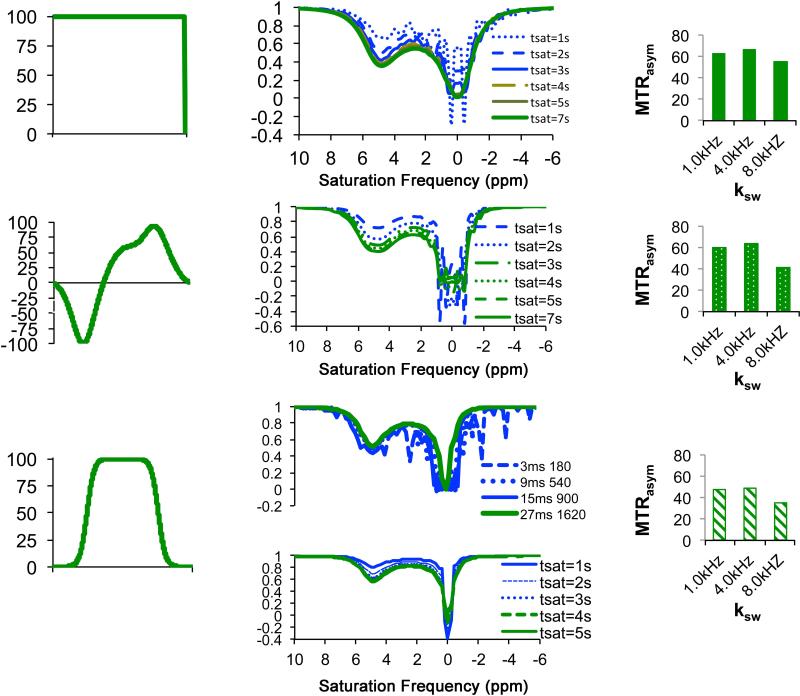
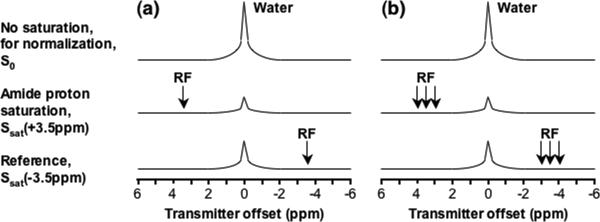
Chemical exchange saturation transfer (CEST) has emerged as a novel MRI contrast mechanism that is well suited for molecular imaging studies. This new mechanism can be used to detect small amounts of contrast agent through the saturation of rapidly exchanging protons on these agents, allowing a wide range of applications. CEST technology has a number of indispensable features, such as the possibility of simultaneous detection of multiple 'colors' of agents and of changes in their environment (e.g. pH, metabolites, etc.) through MR contrast. Currently, a large number of new imaging schemes and techniques are being developed to improve the temporal resolution and specificity and to correct for the influence of B0 and B1 inhomogeneities. In this review, the techniques developed over the last decade are summarized with the different imaging strategies and post-processing methods discussed from a practical point of view, including the description of their relative merits for the detection of CEST agents. The goal of the present work is to provide the reader with a fundamental understanding of the techniques developed, and to provide guidance to help refine future applications of this technology. This review is organized into three main sections ('Basics of CEST contrast', 'Implementation' and 'Post-processing'), and also includes a brief Introduction and Summary. The 'Basics of CEST contrast' section contains a description of the relevant background theory for saturation transfer and frequency-labeled transfer, and a brief discussion of methods to determine exchange rates. The 'Implementation' section contains a description of the practical considerations in conducting CEST MRI studies, including the choice of magnetic field, pulse sequence, saturation pulse, imaging scheme, and strategies to separate magnetization transfer and CEST. The 'Post-processing' section contains a description of the typical image processing employed for B0 /B1 correction, Z-spectral interpolation, frequency-selective detection and improvement of CEST contrast maps.


Figures

Figure 1
Figure 1
The exchange pathways that can result in CEST contrast: a) proton exchange; b) molecule exchange; c) proton+molecule; d) compartment exchange; and e) macromolecule mediated compartment exchange.
Figure 2
Figure 2
Schematic of Chemical exchange saturation transfer (CEST): principles and measurement approach for pure exchange effects. a, b) Solute protons (blue) are saturated at their specific resonance frequency in the proton spectrum (here 8.25 ppm for amide protons). This saturation is transferred to water (4.75 ppm) at exchange rate ksw and nonsaturated protons (black) return. After a period (tsat), this effect becomes visible on the water signal (b, right). c) Measurement of normalized water saturation (Ssat/S0) as a function of irradiation frequency, generating a so-called z-spectrum (or CEST spectrum or MT spectrum). When irradiating the water protons at 4.75 ppm, the signal disappears due to direct (water) saturation (DS). This frequency is assigned to 0 ppm in z-spectra. At short saturation times, only this direct saturation is apparent. At longer tsat the CEST effect becomes visible at the frequency of the low- concentration exchangeable solute protons, now assigned to 8.25 - 4.75 = 3.5 ppm in the z-spectrum. d) result of magnetization transfer ratio asymmetry analysis of the z-spectrum with respect to the water frequency to remove the effect of direct saturation. Reproduced from reference (11) with permission.
Figure 3
Figure 3
Four MRI methods for estimating exchange using varied saturation power or saturation time. a) QUEST; b) QUESP; c) Omega plot; and d) QUESTRA. These were reproduced from reference(78) (a-b), (96) (c), and(97) (d).
Figure 4
Figure 4
Diagram depicting the differences between the FLEX sequence and standard Saturation Transfer sequence for creating frequency sensitive exchange contrast; a) FLEX sequence with the evolution time (tevol) of the LTM's adjusted to allow frequency labeling of the modulations in water signal. The magnitude of the water signal is modulated as a function of tevol through exchange transfer; b) Two versions of Saturation Transfer are shown: continuous wave saturation (upper panel); and pulsed saturation (lower panel); For both the o1 frequency is adjusted to provide frequency specific contrast; c) FLEX data can be reconstructed as a free-induction decay (FID) of amplitude PTRs containing the signal of the exchangeable protons. A Fourier transform provides the spectrum. Reproduced from reference (73) with permission;
Figure 5
Figure 5
Numerical simulation of B0 field dispersion influences on CEST contrast in the mouse cortex using the Bloch equations: a) z spectra, b) MTRasym plots, and c) peak CEST values plotted against the B0 field with the proton exchange rate ranging from 30 Hz to 1000 Hz. The parameters for these simulation were: Δω = 3.5ppm, ksw = 30Hz (except for panel c), B1 = 4.7 μT (200 Hz), T1s and T2s are T1w and T2w are used as reported in the literature and listed in Table 1.
Figure 6
Figure 6
Two strategies to create CEST contrast when using fast MRI sequences: a) Pulse sequence diagram of a PARACEST detection method with a multiple-echo imaging scheme; b) Pulse sequence diagram of a PARACEST detection method with a short repetitive saturation scheme. For both schemes, m represents the number of selective saturation pulses that comprise 's, and R represents the number of repetitions. For presat-RARE, n represents the number of echos that are acquired per excitation (a.k.a., RARE factor), the product of n and N represents the number of phase encoding steps, and the first lobe of Gread alternates in phase for each successive echo. For presat-FLASH, N represents the number of phase encoding steps. Reproduced from Fig.1 in reference (91) with permission.
Figure 7
Figure 7
Simulations of saturation transfer performance for different types of saturation pulses to illustrate some of the issues worth considering when using different waveforms. Simulations were performed setting Δω= 5ppm, xca=1:2000, R1w=0.25, R2w = 0.7. These were performed using the Spinevolution program. a) RECT Waveform, b) tsat dependent z-spectra with ksw= 1 kHz, B1 = 10.6 μT. By tsat = 4 sec, the oscillations are mostly removed; c) MTRasym at Δω = 5 ppm, tsat = 7 sec,; d) dSNOB Waveform; e) tsat dependent z-spectra with tpul = 5 msec, θ = 180°; f) MTRasym at Δω = 5 ppm, tsat =7 sec; g) Fermi Waveform h) flip angle (upper) and tsat dependent with tpul= 27 msec, θ = 1620° (lower) z-spectra and i) MTRasym at Δω = 5 ppm.
Figure 8
Figure 8
Schemes for APTw image acquisition: a) Minimal two-offset APT scan (+3.5 ppm for label, –3.5 ppm for reference); b) Six-offset APT scan (±3, ±3.5, ±4 ppm). The effects of conventional MT and direct water saturation reduce the water signal intensities at all offsets (±3, ±3.5, ±4 ppm), and the existence of APT causes an extra reduction around 3.5 ppm. Reproduced from reference (123) with permission.
Figure 9
Figure 9
In vivo demonstration of the LOVARS scheme as applied to the imaging of 9L gliosarcomas in mice. a) T2-w scout image; b) B0 shift map (WASSR); c) uncorrected MTRasym map; d) LOVARS time domain data (top) with phase (middle) and magnitude (bottom) traces determined through FFT with ROIs as marked in c, ROI1: tumor region and ROI2: control tissue with large B0 shift. The arrows point to the average phase (bottom) and magnitude (middle) in ROI1 and ROI2 at 1cycle/LU based on FFT; e) LOVARS phase map calculated using FFT; f) LOVARS phase map calculated using GLM; g) thresholded LOVARS imaginary component map. Reproduced from reference (125) with permission.
Figure 10
Figure 10
Overview of a typical protocol to acquire and process CEST data. Reproduced from reference (138) with permission.
Figure 11
Figure 11
a) Multicolor spectrum of DIACEST, artificial colors are assigned according to the exchangeable proton chemical shifts for a variety of diamagnetic agents, which range from 0 to 7 ppm(3); b) In vivo realization of the Multi-color imaging. Reproduced from reference (3) with permission.

References

    1. Ward KM, Aletras AH, Balaban RS. A new class of contrast agents for MRI based on proton chemical exchange dependent saturation transfer (CEST). J Magn Reson. 2000;143(1):79–87. - PubMed
    1. Forsén S, Hoffman RA. Study of moderately rapid chemical exchange reactions by means of nuclear magnetic double resonance. The Journal of Chemical Physics. 1963;39:2892.
    1. Liu G, Moake M, Har-el YE, Long CM, Chan KW, Cardona A, Jamil M, Walczak P, Gilad AA, Sgouros G, van Zijl PC, Bulte JW, McMahon MT. In vivo multicolor molecular MR imaging using diamagnetic chemical exchange saturation transfer liposomes. Magn Reson Med. 2012;67(4):1106–1113. - PMC - PubMed
    1. Liu G, Gilad AA, Bulte JW, van Zijl PC, McMahon MT. High-throughput screening of chemical exchange saturation transfer MR contrast agents. Contrast Media Mol Imaging. 2010;5(3):162–170. - PMC - PubMed
    1. McMahon MT, Gilad AA, DeLiso MA, Cromer Berman SM, Bulte JWM, van Zijl PCM. New “multicolor” polypeptide diamagnetic chemical exchange saturation transfer (DIACEST) contrast agents for MRI. Magn Reson Med. 2008;60(4):803–812. - PMC - PubMed

Publication types