Case Reports
. 2013 Apr;3(4):458-469.
doi: 10.1158/2159-8290.CD-12-0464. Epub 2013 Jan 9.

Primary melanoma of the CNS in children is driven by congenital expression of oncogenic NRAS in melanocytes

Affiliations
Case Reports

Primary melanoma of the CNS in children is driven by congenital expression of oncogenic NRAS in melanocytes

Malin Pedersen et al. Cancer Discov. 2013 Apr.

Abstract

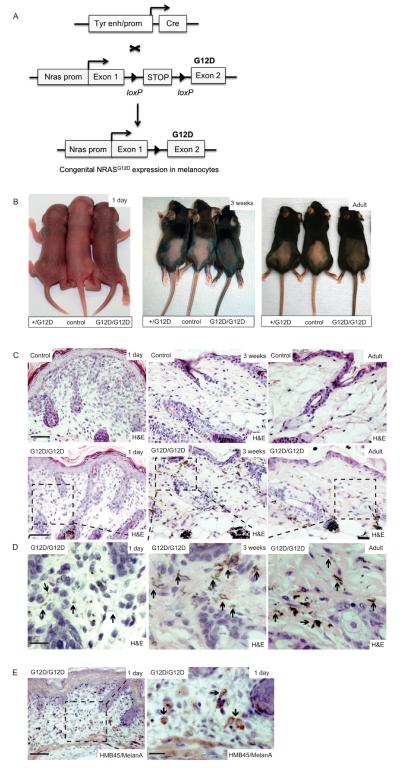
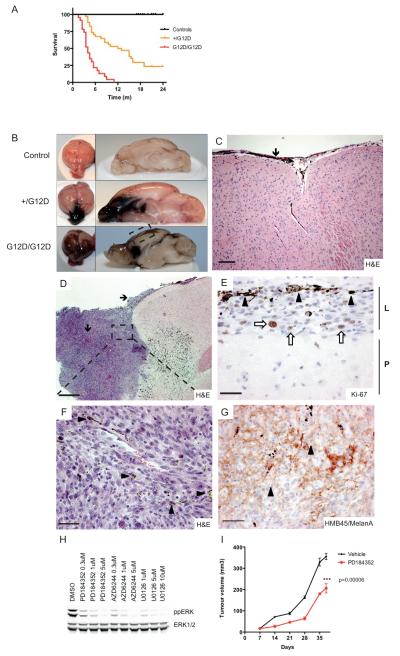
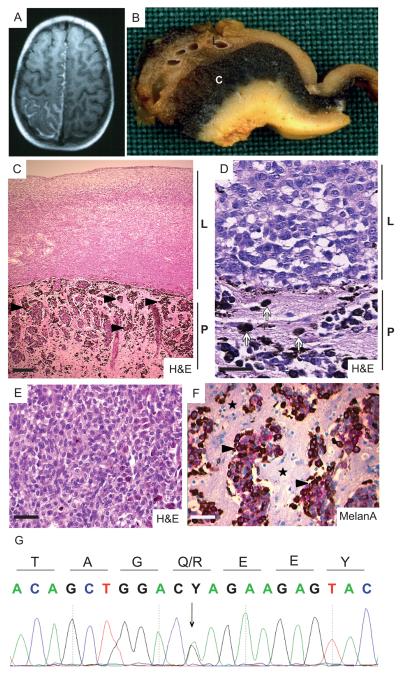
NRAS mutations are common in human melanoma. To produce a mouse model of NRAS-driven melanoma, we expressed oncogenic NRAS (NRAS(G12D)) in mouse melanocytes. When NRAS(G12D) was expressed in the melanocytes of developing embryos, it induced melanocyte proliferation and congenital melanocytic lesions reminiscent of human blue nevi but did not induce cutaneous melanoma. Unexpectedly, however, it did induce early-onset primary melanoma of the central nervous system (CNS). The tumors were rapidly proliferating and caused neurologic symptoms, rapid health deterioration, and death. NRAS is not a common driver oncogene of primary melanoma of the CNS in adults, but we report two cases of primary melanoma of the CNS in children, both of which carried oncogenic mutations in NRAS. We conclude that acquisition of somatic mutations in NRAS in CNS melanocytes is a predisposing risk factor for primary melanoma of the CNS in children, and we present a mouse model of this disease.

Significance: We show that the acquisition of NRAS mutations in melanocytes during embryogenesis is a risk factor for early-onset melanoma of the CNS. We have developed a powerful mouse model to study this rare but devastating childhood disease, and to develop therapeutic approaches for its treatment.


Figures

Figure 1
Figure 1. NRASG12D induces skin pigmentation and congenital nevi
(A) Schematic representation of the conditional-inducible approach used to express NRASG12D in embryonic mouse melanocytes. A tyrosinase gene enhancer/promoter construct (Tyr enh/prom) was used to express Cre-recombinase (Cre) in melanocytes from embryonic day ~10.5 (38). NRASG12D was expressed from the endogenous mouse Nras gene using a conditional-inducible targeted allele in which exon 2 is mutated to introduce the G12D mutation (32). The loxP-STOP-loxP cassette blocks NRASG12D expression, but its removal by Cre-recombinase releases the block on expression. (B) Photographs showing skin pigmentation in control, Nras+/LSL-G12D;Tyr::CreA/° (+/G12D), and NrasLSL-G12D/LSL-G12D;Tyr::CreA/° (G12D/G12D) mice, at 1 day, 3 weeks, and in adulthood. (C) Upper panels: photomicrographs of H&E stained skin in 1 day old, 3 week old and adult mouse skin. Scalebar = 200μm. Lower panels: low power photomicrographs of H&E stained skin in 1 day old, 3 week old and adult NrasLSL-G12D/LSL-G12D;Tyr::CreA/° (G12D/G12D) mice. Hyperpigmented dendritic melanocytes are visible at low magnification in the 3 week old and adult mice. Scalebar = 200μm. n=6 mice / experimental group. (D) High power photomicrographs of H&E stained skin from boxed areas in the lower panel from (C) in 1 day old, 3 week old and adult NrasLSL-G12D/LSL-G12D;Tyr::CreA/° (G12D/G12D) mice. Hyperpigmented dendritic melanocytes in the papillary and reticular dermis, and along the hair follicles and adnexal glands are indicated (black arrows) and are sparse in the skin of day 1 old mice, but are prominent in 3 week old and adult mice. Scalebar = 20μm. (E) Photomicrographs of HMB45/MelanA stained skin from a 1 day old NrasLSL-G12D/LSL- G12D;Tyr::CreA/° (G12D/G12D) mouse, demonstrating the presence of melanocytes (black arrows). The area boxed in the left hand panel is enlarged in the right hand panel. Scale bars = 200μm (left panel) and 20μm (right panel).
Figure 2
Figure 2. NrasG12D induces CNS tumors in mice
(A) Kaplan-Meier plot showing survival in months (m) of study mice. The experimental groups consisted of Nras+/LSL-G12D;Tyr::CreA/° (+/G12D; n=33) and NrasLSL-G12D/LSL-G12D;Tyr::CreA/° (G12D/G12D; n=23) mice. The control groups consisted of Tyr::CreA/° (n=22), Nras+/LSL-G12D (n=13) and NrasLSL-G12D /LSL-G12D (n=15) mice. (B) Photographs showing representative whole brain and sagital sections of the brains of control, Nras+/LSL-G12D;Tyr::CreA/° (+/G12D) and NrasLSL-G12D/LSL- G12D;Tyr::CreA/° (G12D/G12D) mice. (C) Photomicrograph of an H&E stained brain section from a NrasLSL-G12D/LSL-G12D;Tyr::CreA/° mouse (boxed area in the left image), displaying proliferation of pigmented melanocytes in the leptomeninges along the external surface of the brain parenchyma (black arrow). Scalebar = 100μm. (D) Photomicrograph of an H&E stained frontal lobe melanoma from an NrasLSL-G12D/LSL-G12D;Tyr::CreA/° mouse, showing leptomeningeal spread of melanoma cells (black arrows). Scalebar = 1mm. (E) Photomicrograph showing nuclear Ki67 staining (white arrows) of a representative melanoma from a NrasLSL-G12D/LSL-G12D;Tyr::CreA/° mouse (boxed area in upper left image). Note that some cells are melanin-laden (black arrowheads). Scalebar = 20μm. (F) High power photomicrograph of boxed area in upper left image of an H&E stained melanoma with atypical, epithelioid cells. Tumor cells frequently presented intracytoplasmic melanin (black arrowheads). Scalebar = 25μm. (G) Photomicrograph showing HMB45/MelanA staining in a representative melanoma from a NrasLSL-G12D/LSL-G12D;Tyr::CreA/° mouse. Note the predominant membranous staining and presence of intracytoplasmic deposits of melanin in the melanoma cells (black arrowheads). Scalebar = 50μm. (H) Western blot analysis of ppERK and total ERK levels of Nras mutant melanoma cells following MEK inhibition for 3h using PD184352, U0126 and AZD6244. (I) In vivo allograft experiment, using Nras mutant cells from a mouse brain melanoma showing the effect of the MEK inhibitor PD184352 on intradermal tumor growth in C57Bl/6 mice. n = 6 PD184352-treated mice and 9 vehicle-treated mice.
Figure 3
Figure 3. NRASG12D induces melanocytosis in embryonic mice
(A) Photograph showing a representative whole brain from an NrasLSL-G12D/LSL-G12D;Tyr::CreA/° (G12D/G12D) and control mouse at 3 weeks of age. Note the hyperpigmentation of leptomeninges following the gyri (black arrow) and sulci (black arrowhead) and the arboriform pattern over the parietal lobe (white arrow). (B) Upper panels: photomicrographs of H&E stained mouse brains of control mice at 1 day and 3 weeks of age showing a single array of non-pigmented leptomeninges lining the cerebral parenchyma (black arrows). Scalebar = 50μm. Lower panel: photomicrographs of H&E stained mouse brains of NrasLSL-G12D/LSL-G12D;Tyr::CreA/° (G12D/G12D) mice at 1 day and 3 weeks of age showing hyperpigmentation and thickening of the leptomeninges (black arrows). Scalebar = 50μm. n = 6 mice / experimental group. (C) Photomicrographs of an HMB45/MelanA stained mouse brain (arrows indicate individual cells) from an NrasLSL-G12D/LSL-G12D;Tyr::CreA/° (G12D/G12D) mouse at 1 day of age. Scalebar = 50μm. The boxed area in the left panel is shown in higher magnification in the right panel.
Figure 4
Figure 4. Diagnosis of leptomeningal melanomatosis carrying an oncogenic mutation in NRAS in patient 1
(A) Axial T1-weighted MRI revealing a hyperintense, contrast-enhancing lesion in the left parieto-occipital region following the gyri and sulci. (B) Photograph showing macroscopic appearance of the cerebral tissue from patient 1. Brownish discoloration of the thickened leptomeninges (L) and black discoloration of the underlying cerebral cortex (C) are evident. (C) Photomicrograph showing H&E staining of the melanoma revealing the proliferation of hypopigmented cells in the leptomeninges (L) and invasion of hyperpigmented cells (black arrowheads) into the CNS parenchyma (P). Scalebar = 100μm. (D) Photomicrograph showing H&E staining of the melanoma. Note the epithelioid morphology of the non-pigmented atypical cells in the leptomeningeal compartment (L) and pigmented tumor cells (white arrows) invading the CNS parenchyma (P). Scalebar = 25μm. (E) Photomicrograph showing detail of epithelioid morphology of pleomorphic melanoma cells in the leptomeningeal compartment. Scalebar = 50μm. (F) Photomicrograph showing MelanA staining of the pigmented melanoma cells (black arrowheads) in the CNS parenchyma (black stars). Scalebar = 50μm. (G) Forward sequence of DNA from the primary CNS melanoma from patient 1 showing the presence of an NRAS c.182A>G, p.(Q61R) mutation (arrow).
Figure 5
Figure 5. Diagnosis of NRAS mutated leptomeningal melanomatosis in patient 2
(A) Photomicrograph showing H&E staining of full-thickness skin from the congenital melanocytic nevus (CMN). Scalebar = 0.5mm. (B) Photomicrograph of the CMN showing detailed H&E staining of melanocytic nests (arrows) in the papillary dermis and single melanocytes in the reticular dermis (arrowhead). Scalebar = 300μm. (C) Photomicrograph of the CMN showing detailed H&E staining of the deep dermal melanocytes in the collagen and along the hair follicle (arrows). Scalebar = 300μm. (D) T1-weighted magnetic resonance image (MRI) with contrast, revealing a large tumor in the right frontotemporal region with meningeal attachment. (E) H&E staining of the CNS melanoma showing epithelioid tumor cells with low pigment content. Scalebar = 50μm. (F) H&E staining of the CNS melanoma. Note the atypical tumor cells with irregular nuclei and frequent nucleoli. Scalebar = 30μm. (G) Photomicrograph showing cytoplasmic brown chromogen MelanA staining in melanoma cells (black arrowhead) invading brain parenchyma (black star) of patient 2. Scalebar = 50μm. (H) Forward sequence of DNA from the primary CNS melanoma from patient 2 showing the presence of an NRAS c.181C>A, p.(Q61K) mutation (arrow).

Comment in

Similar articles

Cited by

References

    1. Gray-Schopfer V, Wellbrock C, Marais R. Melanoma biology and new targeted therapy. Nature. 2007;445:851–7. - PubMed
    1. Broekaert SM, Roy R, Okamoto I, van den Oord J, Bauer J, Garbe C, et al. Genetic and morphologic features for melanoma classification. Pigment Cell Melanoma Res. 2010;23:763–70. - PMC - PubMed
    1. Bradford PT, Goldstein AM, McMaster ML, Tucker MA. Acral lentiginous melanoma: incidence and survival patterns in the United States, 1986-2005. Arch Dermatol. 2009;145:427–34. - PMC - PubMed
    1. Chang AE, Karnell LH, Menck HR. The National Cancer Data Base report on cutaneous and noncutaneous melanoma: a summary of 84,836 cases from the past decade. Cancer. 1998;83:1664–78. - PubMed
    1. Seddon JM, Gragoudas ES, Glynn RJ, Egan KM, Albert DM, Blitzer PH. Host factors, UV radiation, and risk of uveal melanoma. A case-control study. Arch Ophthalmol. 1990;108:1274–80. - PubMed

Publication types