. 2013 Jan 9;33(2):452-63.
doi: 10.1523/JNEUROSCI.2136-12.2013.

Amphetamine paradoxically augments exocytotic dopamine release and phasic dopamine signals

Affiliations

Amphetamine paradoxically augments exocytotic dopamine release and phasic dopamine signals

D P Daberkow et al. J Neurosci. .

Abstract

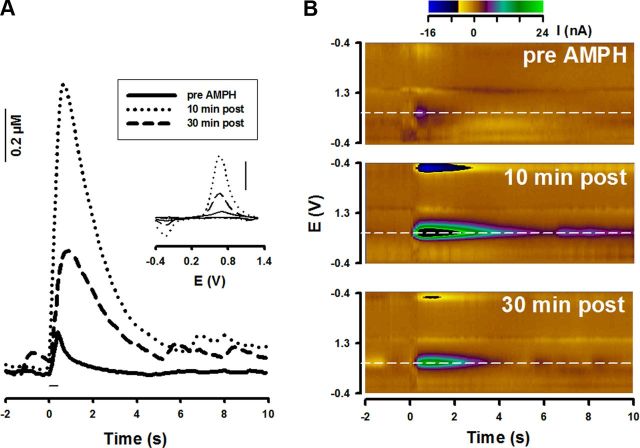
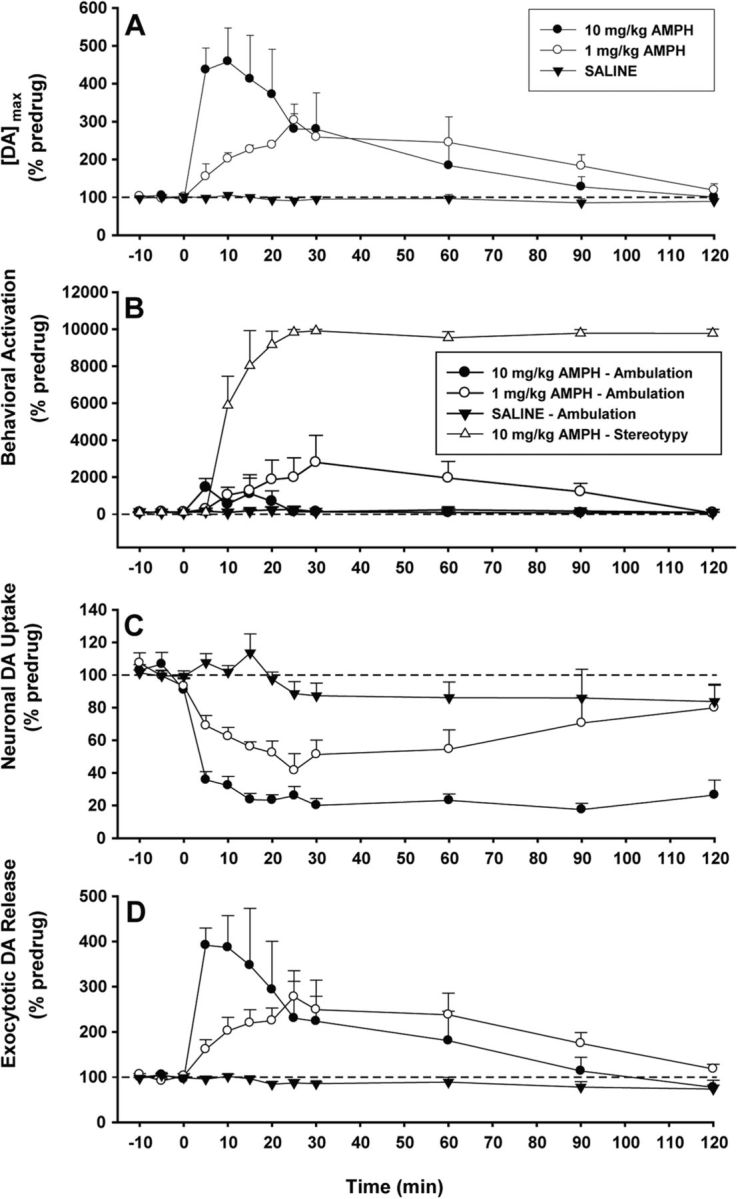
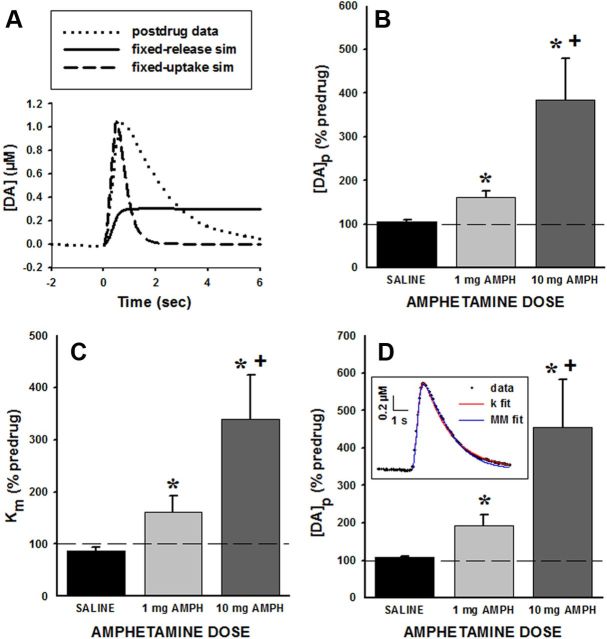
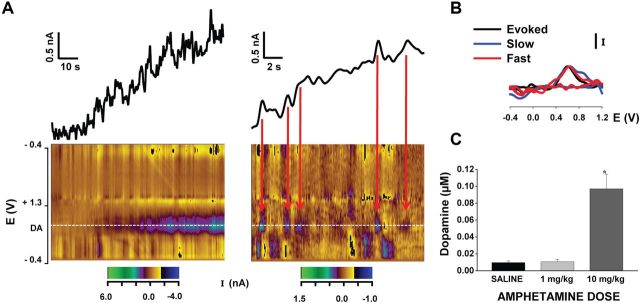
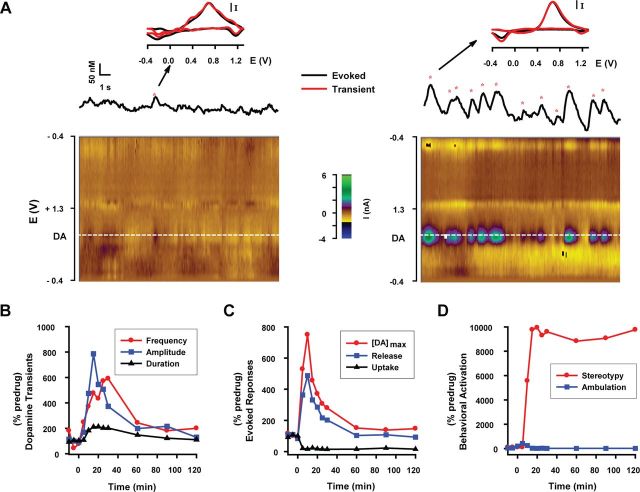
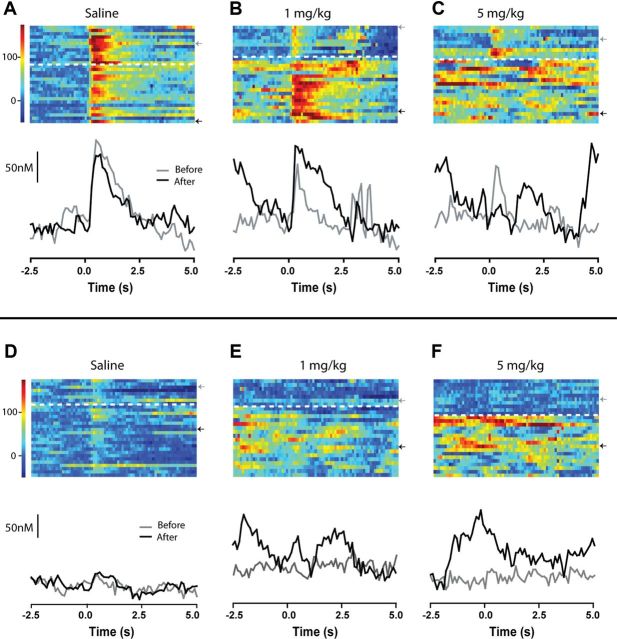
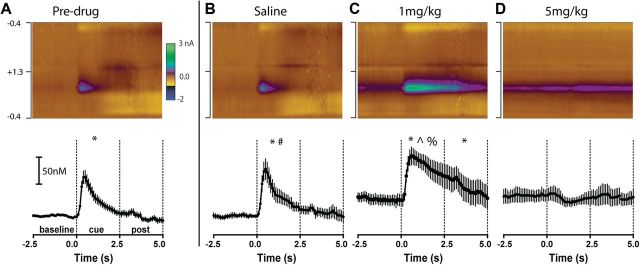
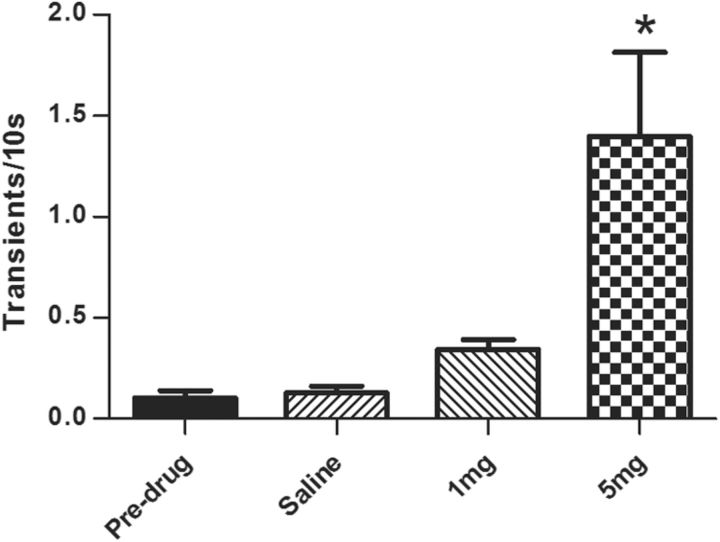
Drugs of abuse hijack brain-reward circuitry during the addiction process by augmenting action potential-dependent phasic dopamine release events associated with learning and goal-directed behavior. One prominent exception to this notion would appear to be amphetamine (AMPH) and related analogs, which are proposed instead to disrupt normal patterns of dopamine neurotransmission by depleting vesicular stores and promoting nonexocytotic dopamine efflux via reverse transport. This mechanism of AMPH action, though, is inconsistent with its therapeutic effects and addictive properties, which are thought to be reliant on phasic dopamine signaling. Here we used fast-scan cyclic voltammetry in freely moving rats to interrogate principal neurochemical responses to AMPH in the striatum and relate these changes to behavior. First, we showed that AMPH dose-dependently enhanced evoked dopamine responses to phasic-like current pulse trains for up to 2 h. Modeling the data revealed that AMPH inhibited dopamine uptake but also unexpectedly potentiated vesicular dopamine release. Second, we found that AMPH increased the amplitude, duration, and frequency of spontaneous dopamine transients, the naturally occurring, nonelectrically evoked, phasic increases in extracellular dopamine. Finally, using an operant sugar reward paradigm, we showed that low-dose AMPH augmented dopamine transients elicited by sugar-predictive cues. However, operant behavior failed at high-dose AMPH, which was due to phasic dopamine hyperactivity and the decoupling of dopamine transients from the reward predictive cue. These findings identify upregulation of exocytotic dopamine release as a key AMPH action in behaving animals and support a unified mechanism of abused drugs to activate phasic dopamine signaling.


Figures

Figure 1.
Figure 1.
AMPH augments action potential-dependent dopamine neurotransmission in awake rats. Dopamine signals in the dorsomedial striatum were evoked by electrical stimulation of ascending dopamine fibers (60 Hz, 24 pulses, 125 μA). A, Data show pre-AMPH injection (solid line) and effects of AMPH (10 mg/kg) on the evoked dopamine signal 10 min postinjection (dotted line) and 30 min postinjection (dashed line). Inset, Individual background-subtracted cyclic voltammograms identify dopamine (scale bar, I = 3.0 nA). B, Pseudo-color plots (x-axis, time; y-axis, applied potential; z-axis, measured current) show the entire electrochemical profile supporting the identification of dopamine as the origin of the evoked responses.
Figure 2.
Figure 2.
AMPH activates presynaptic mechanisms of dopamine signaling and motoric behavior in a dose-dependent fashion. A, AMPH robustly increased the maximal concentration of dopamine ([DA]max) elicited by the electrical stimulation (saline, n = 5; 1 mg/kg AMPH, n = 5; 10 mg/kg AMPH, n = 6). B, AMPH elicited behavioral activation in the form of ambulation and stereotypy at low and high doses, respectively. Minimal ambulation was observed during the predrug session and with saline or 10 mg/kg AMPH. No stereotypy was observed during the predrug session and with saline or 1 mg/kg AMPH. C, AMPH inhibited neuronal dopamine uptake (k). D, AMPH increased exocytotic dopamine release ([DA]p).
Figure 3.
Figure 3.
Verification of analysis resolving measures of dopamine release and uptake. Additional analyses were performed to verify that AMPH-induced increases in the electrically evoked dopamine signal measured in awake rats were due to a combination of an upregulation of exocytotic dopamine release and an inhibition of neuronal dopamine uptake. A, A sole alteration in either exocytotic dopamine release or neuronal dopamine uptake was not sufficient to capture AMPH effects. Shown are a raw data trace of the evoked dopamine signal collected 10 min post-AMPH (dotted line), with a simulation based on fixing dopamine release at the predrug value and decreasing dopamine uptake to zero (solid line), and with a simulation based on fixing dopamine uptake at the predrug value and increasing dopamine release until the signal maximum matched the postdrug level (dashed line). Even decreasing uptake to zero could not raise the calculated signal amplitude to the observed response. While increasing release did achieve a similar signal amplitude, the rate of uptake in the calculated response was clearly too fast compared with the observed response. B, Single-curve analysis demonstrated an upregulation of exocytotic dopamine release for the 10 min post-AMPH responses in a dose-dependent fashion (saline, n = 5; 1 mg/kg AMPH, n = 5; 10 mg/kg AMPH, n = 6). C, D, The suitability of using first-order uptake kinetics was tested by analyzing data obtained 10 min post-AMPH injection with Michaelis–Menten uptake kinetics. C, AMPH increased Km for dopamine uptake in a dose-dependent fashion. Km is expressed as percentage of the predrug response (% predrug). D, AMPH increased [DA]p, the exocytotic dopamine release term, in a dose-dependent fashion. [DA]p is expressed as percentage of predrug response (% predrug). Inset, Simulation based on dopamine release and uptake parameters obtained by first-order uptake kinetics (k fit) and Michaelis–Menten analysis (MM fit) well described the measured response, demonstrating the veracity of the curve fitting. *p < 0.05, significantly different from saline; + significantly different from 1 mg/kg AMPH. Bars represent the mean ± 1 SEM.
Figure 4.
Figure 4.
AMPH elicits increases in basal dopamine levels. A, Background current monitored pre-AMPH and post-AMPH injection provided a relative measure of drug-induced changes in basal extracellular dopamine. Ten milligrams per kilogram AMPH elicited a slow but small (magnitude, ∼100 nm) and short-lived (duration, ∼2 min) increase in the background current that may reflect, in part, dopamine efflux (left). Faster signals (i.e., phasic dopamine transients) are observed riding on top of this more slowly emerging envelope (right). Pseudocolor plots (x-axis, time; y-axis, applied potential; z-axis, measured current) show the entire electrochemical profile supporting the identification of dopamine as the origin of both slow and fast signals. B, Background-subtracted cyclic voltammograms also identify both slow and fast changes in background signal as dopamine. C, Average amplitude of the slow increases in extracellular dopamine levels (saline, n = 5; 1 mg/kg AMPH, n = 5; 10 mg/kg AMPH, n = 6). *p < 0.05, significantly different from saline and 1 mg/kg. Bars represent the mean ± 1 SE.
Figure 5.
Figure 5.
AMPH concurrently alters phasic dopamine transients, dopamine release and uptake, and motoric behavior. A, AMPH activates phasic dopamine signaling. Red asterisks denote spontaneous phasic transients identified as dopamine and collected predrug (left) or after 10 mg/kg AMPH (right). Background-subtracted cyclic voltammograms, shown for example transients denoted by the arrow (red line) and for the electrically evoked response (black line), identify dopamine as the signal source. Current is normalized. Pseudocolor plots (x-axis, time; y-axis, applied potential; z-axis, measured current) demonstrate the entire electrochemical record of transients and their identity as dopamine. B, AMPH increased the frequency, amplitude, and duration of dopamine transients. C, AMPH increased the magnitude of the evoked dopamine signal ([DA]max) and exocytotic dopamine release ([DA]p), and inhibited dopamine uptake (k). D, AMPH preferentially increased stereotypy over ambulation. All data were collected in a single animal. Data in B, C, and D were reported as percentage predrug.
Figure 6.
Figure 6.
Representative examples of AMPH modulation during the discriminative stimulus task. Each panel represents data from an individual rat. A–C, Dopamine responses on DS+ trials. Effects of saline (A), 1 mg/kg AMPH (B), and 5 mg/kg AMPH (C). Conventions are the same for all panels. Top, Heat map in which each row represents an individual trial aligned to DS+ onset (time 0), with dopamine (nm) concentration shown in color in 100 ms bins. Rows above and below the dashed white line depict trials before and after, respectively, injection. Bottom, Exemplar trials showing dopamine concentration over time taken from the before (gray line) and after injection (black line) phases of the experiment. Gray (before) and black (after) arrows next to the heat map denote the trials illustrated below. D–F, Dopamine responses on DS− trials before and after injection of saline (D), 1 mg/kg AMPH (E), and 5 mg/kg (F) AMPH. All conventions are as in above.
Figure 7.
Figure 7.
AMPH dose-dependently alters dopamine evoked by a reward predictive cue. Conventions are the same for all panels. A–D, Top, Average pseudocolor plot (x-axis, time; y-axis, applied potential; z-axis, measured current) shows the entire electrochemical profile supporting the identification of dopamine evoked by the DS+. Bottom, The average dopamine response time-locked to the DS+. Individual points represent mean dopamine and error bars represent ± 1 SEM. The vertical dashed lines demarcate epochs (baseline, cue, post) used for statistical analyses. Data are shown predrug (n = 20) (A), and after saline (n = 7) (B), 1 mg/kg AMPH (n = 6) (C), and 5 mg/kg AMPH (n = 7) (D). *, epochs significantly (p < 0.05) different from the baseline epoch before injection. # indicates that the cue epoch is significantly different from saline baseline. ∧ indicates that the cue epoch is significantly different from 1 mg/kg baseline. % indicates that the cue epoch is significantly different from the before injection cue epoch.
Figure 8.
Figure 8.
AMPH dose-dependently increases the frequency of phasic dopamine transients during the DS paradigm. The number of dopamine transients was determined for each 10 s period before cue onset before and after drug injection. Before injection, transient frequency did not differ across groups and were therefore collapsed (n = 20). Rats were injected with saline (n = 7), 1 mg/kg AMPH (n = 6), or 5 mg/kg (n = 7) AMPH. *, significantly different from all other groups (p < 0.05). Bars represent the mean ± 1 SE.

Comment in

Similar articles

Cited by

References

    1. Anderson BB, Chen G, Gutman DA, Ewing AG. Dopamine levels of two classes of vesicles are differentially depleted by amphetamine. Brain Res. 1998;788:294–301. - PubMed
    1. Bowyer JF, Masserano JM, Weiner N. Inhibitory effects of amphetamine on potassium-stimulated release of [3H]dopamine from striatal slices and synaptosomes. J Pharmacol Exp Ther. 1987;240:177–186. - PubMed
    1. Brown HD, McCutcheon JE, Cone JJ, Ragozzino ME, Roitman MF. Primary food reward and reward-predictive stimuli evoke different patterns of phasic dopamine signaling throughout the striatum. Eur J Neurosci. 2011;34:1997–2006. - PMC - PubMed
    1. Cesca F, Baldelli P, Valtorta F, Benfenati F. The synapsins: key actors of synapse function and plasticity. Prog Neurobiol. 2010;91:313–348. - PubMed
    1. Chadchankar H, Ihalainen J, Tanila H, Yavich L. Methylphenidate modifies overflow and presynaptic compartmentalization of dopamine via an alpha-synuclein-dependent mechanism. J Pharmacol Exp Ther. 2012;341:484–492. - PubMed

Publication types

MeSH terms