. 2013 Jan 9;33(2):563-73.
doi: 10.1523/JNEUROSCI.1214-12.2013.

Gestational stress promotes pathological apneas and sex-specific disruption of respiratory control development in newborn rat

Affiliations

Gestational stress promotes pathological apneas and sex-specific disruption of respiratory control development in newborn rat

Stéphanie Fournier et al. J Neurosci. .

Abstract

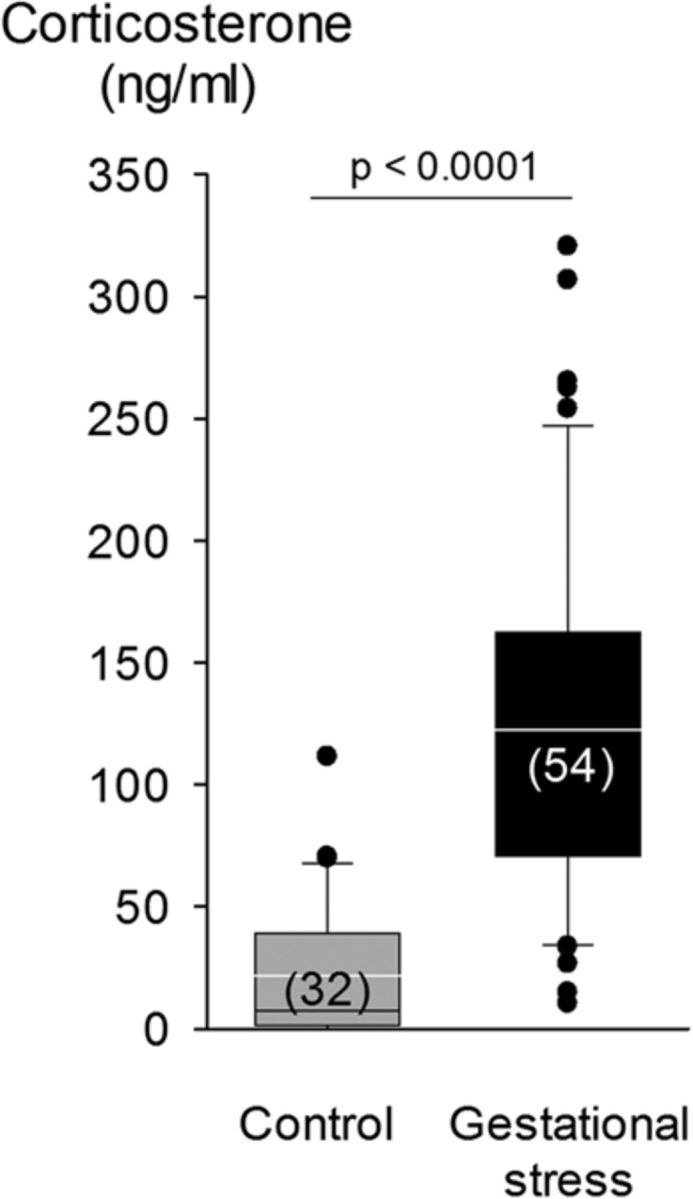
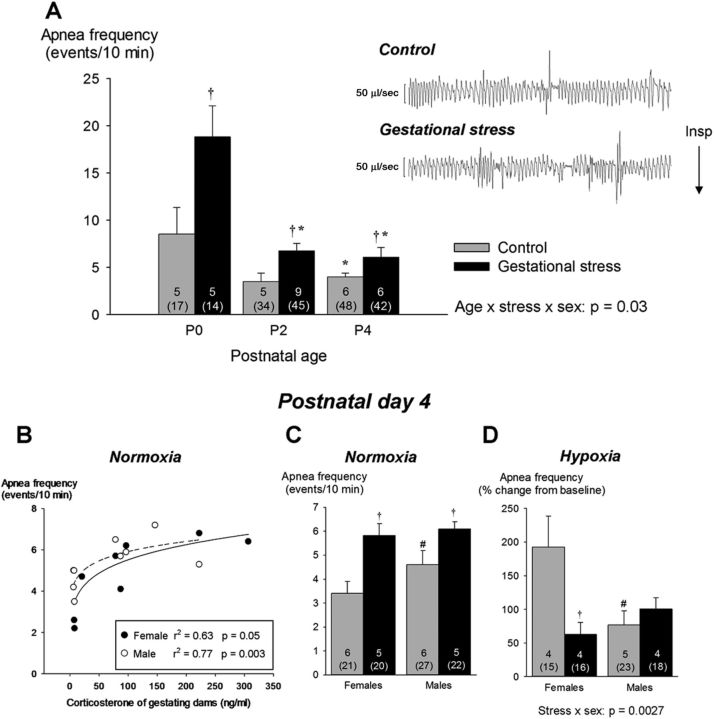
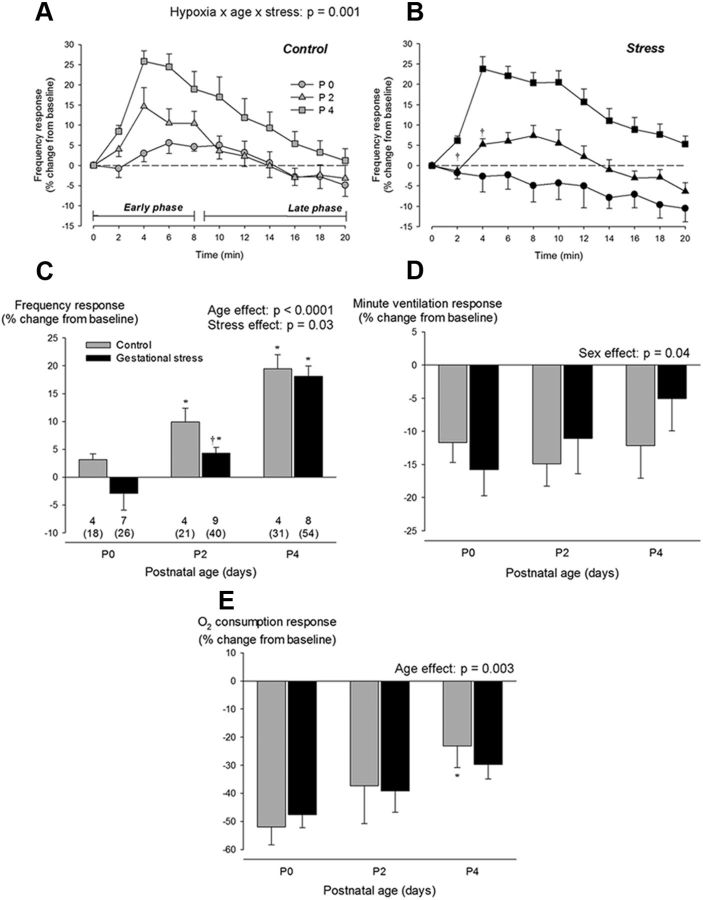
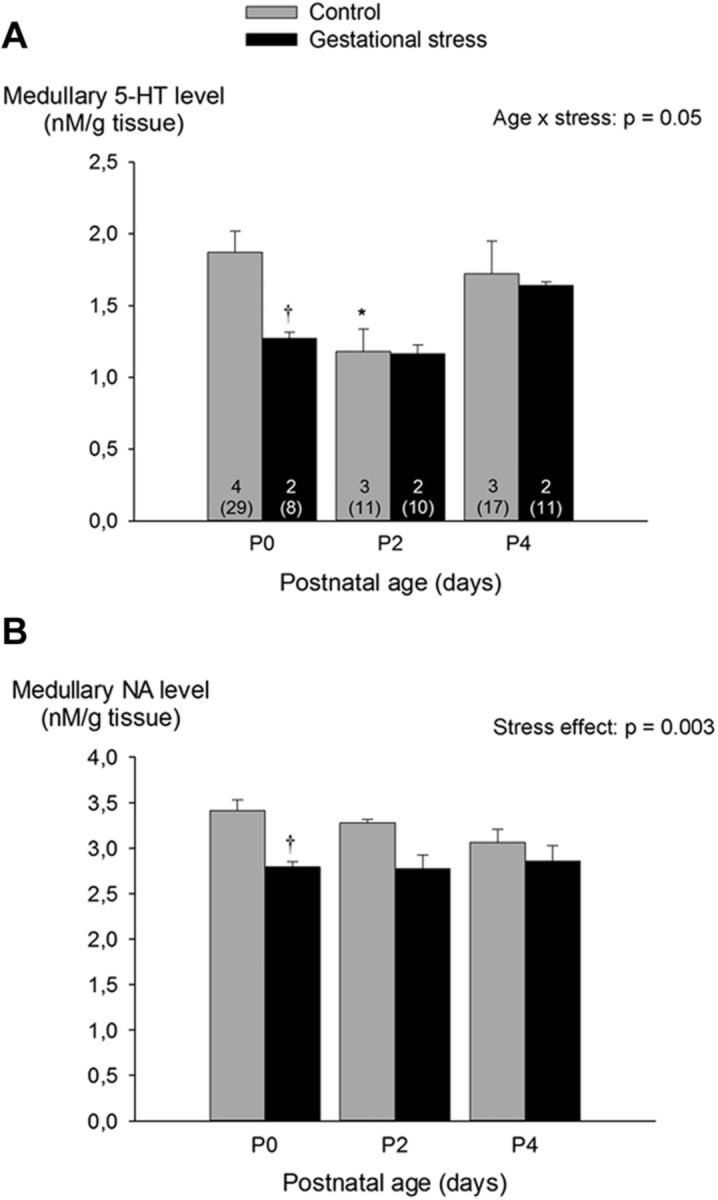
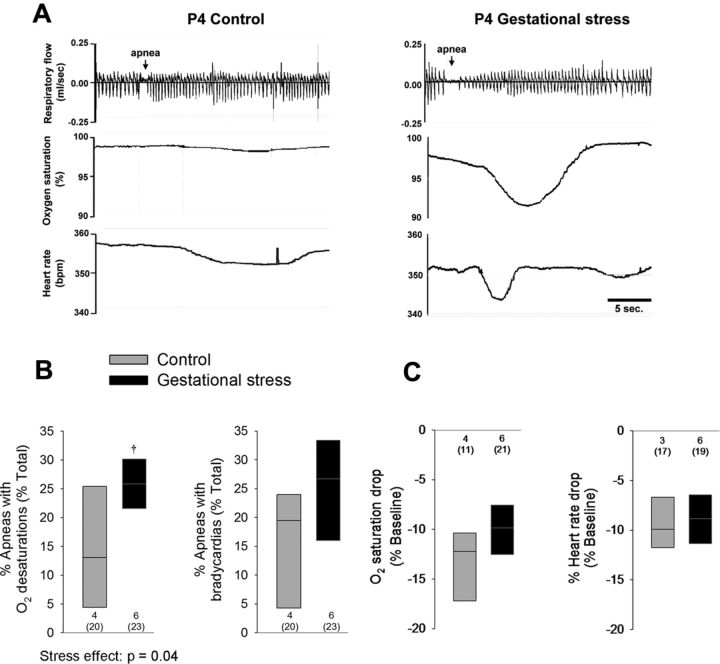
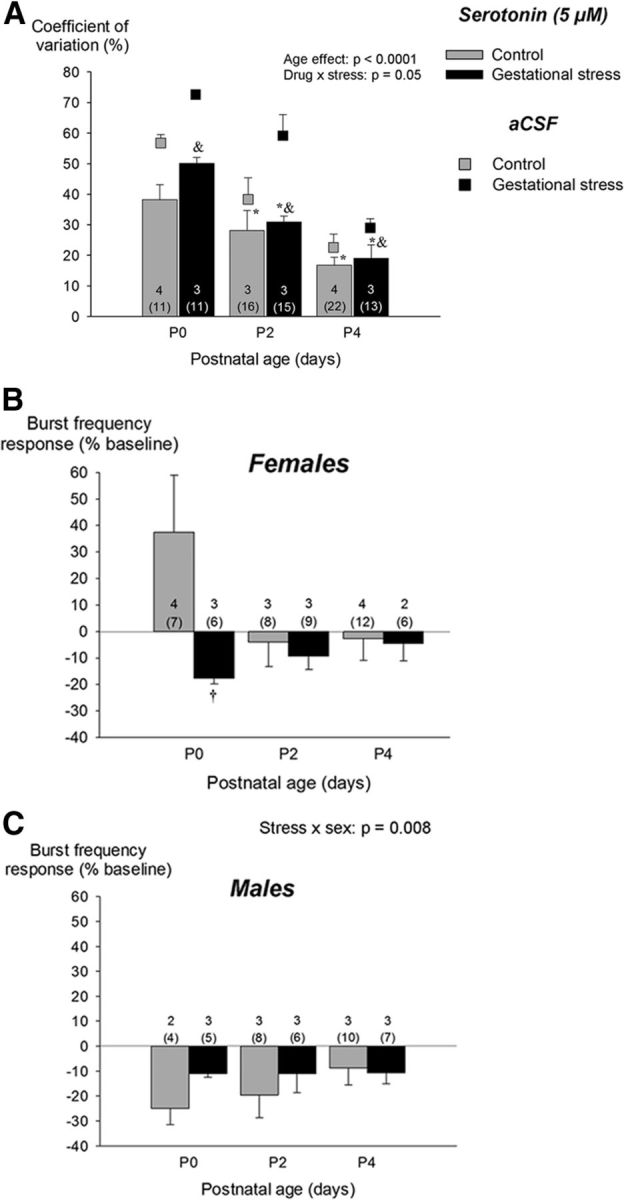
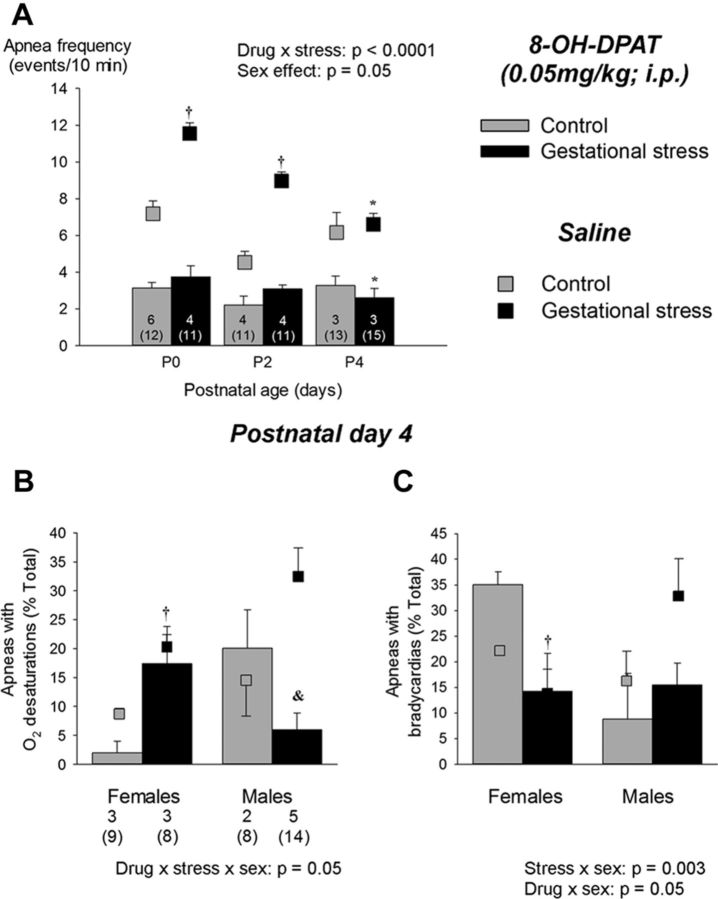
Recurrent apneas are important causes of hospitalization and morbidity in newborns. Gestational stress (GS) compromises fetal brain development. Maternal stress and anxiety during gestation are linked to respiratory disorders in newborns; however, the mechanisms remain unknown. Here, we tested the hypothesis that repeated activation of the neuroendocrine response to stress during gestation is sufficient to disrupt the development of respiratory control and augment the occurrence of apneas in newborn rats. Pregnant dams were displaced and exposed to predator odor from days 9 to 19 of gestation. Control dams were undisturbed. Experiments were performed on male and female rats aged between 0 and 4 d old. Apnea frequency decreased with age but was consistently higher in stressed pups than controls. At day 4, GS augmented the proportion of apneas with O(2) desaturations by 12%. During acute hypoxia (12% O(2)), the reflexive increase in breathing augmented with age; however, this response was lower in stressed pups. Instability of respiratory rhythm recorded from medullary preparations decreased with age but was higher in stressed pups than controls. GS reduced medullary serotonin (5-HT) levels in newborn pups by 32%. Bath application of 5-HT and injection of 8-OH-DPAT [(±)-8-hydroxy-2-di-(n-propylamino) tetralin hydrobromide; 5-HT(1A) agonist; in vivo] reduced respiratory instability and apneas; these effects were greater in stressed pups than controls. Sex-specific effects were observed. We conclude that activation of the stress response during gestation is sufficient to disrupt respiratory control development and promote pathological apneas in newborn rats. A deficit in medullary 5-HT contributes to these effects.


Figures

Figure 1.
Figure 1.
Box plot of the plasma corticosterone levels measured in gestating dams maintained under standard animal care conditions (control; gray bars; n = 32) and females subjected to GS (black bars; n = 54). Tail blood samples were taken at 9:20 A.M. on G12. Box boundaries correspond to the 25th and 75th percentiles (top and bottom, respectively); the line within the box indicates the median. Bars above and below show the 90th and 10th percentiles, respectively. Individual points are outside these limits.
Figure 2.
Figure 2.
A, Effects of GS on apnea frequency during neonatal development (P0–P4); the right side of the panel presents 30 s segments of plethysmographic recordings illustrating respiratory instability and apneas in newborn pups (P0) born from control (top trace) and stressed (bottom trace) dams. Apnea frequency is the sum of spontaneous and post-sigh apneas measured during baseline recording (normoxia). Because sex-specific differences were apparent only at P4, the bottom panels present data from males and females separately. B, Relationships between maternal corticosterone measured on G12 and mean apnea frequency measured at P4 for each litter. Data for males and females are represented by open and filled circles, respectively. C, Apnea frequency measured in 4-d-old male and female pups under normoxic conditions. D, Apnea frequency observed at the end of hypoxic exposure. Values are expressed as means ± SEM. Note that the mean values are based on litter means. These data were obtained from a total of 200 pups (99 controls and 101 stress) originating from 27 litters (12 controls and 15 stress). In the figure, the numbers within bars indicate the number of litters used in each group, the number underneath (in brackets) indicate the total number of pups sampled. Gray bars, Controls; black bars, GS. *p < 0.05, statistically different from corresponding value measured in newborn (P0, <18 h old). p < 0.05, statistically different from control value. #p < 0.05, statistically different from corresponding female value.
Figure 3.
Figure 3.
Neonatal development of the ventilatory response to hypoxia in pups born to control dams (gray) versus pups born to dams subjected to GS (black). Time course of the fR response to hypoxia in three distinct age groups: P0 (circles), P2 (triangles), and P4 (squares). This representation illustrates the early (first 8 min) and late phases (minutes 9 to 20) of the response. Results are compared between control pups (A; gray) and pups born to dams subjected to GS (B; black). C, Comparison of the mean frequency response observed during the early phase of hypoxia. Effects of GS on V̇e (D) and V̇O2 (E) responses measured at the end of hypoxic exposure (late phase). Ventilatory measurements were performed using whole-body, flow-through plethysmography during exposure to moderate hypoxia (FiO2 = 0.12; 20 min). Values are expressed as percentage change from baseline values and are reported as means ± SEM. Note that mean values are based on litter means. These data were obtained from a total of 190 pups (70 controls and 120 stress) originating from 22 litters (7 controls and 15 stress). Numbers below the bars (C) indicate the number of litters used in each group, the number underneath (in parentheses) indicates the total number of pups sampled. *p < 0.05, statistically different from P0. p < 0.05, statistically different from control value.
Figure 4.
Figure 4.
Effects of GS on medullary levels of 5-HT (A) and NA (B) in developing newborn rat pups. Measurements were performed by HPLC. Gray bars, Controls; black bars, GS. Values are expressed as means ± SEM. Note that mean values are based on litter means. These data were obtained from a total of 86 pups (57 controls and 29 stress) originating from nine litters (7 controls and 2 stress). Numbers within the bars (A) indicate the number of litters used in each group, and the number underneath (in parentheses) indicate the total number of medullas sampled. *p < 0.05, statistically different from P0. p < 0.05, statistically different from corresponding control value.
Figure 5.
Figure 5.
A, Effects of GS on age-dependent changes in basal phrenic burst frequency produced by in vitro medullary preparations. Because sex-specific differences were apparent only at P4, B presents data from males and females separately. C, Developmental change of the CV of the interburst interval between pups born from control dams (gray bars) versus dams subjected to GS (black bars). D, Phrenic neurograms (integrated signal) from 2-d-old pups illustrating differences in variability observed between preparations from stressed and control pups. Values are expressed as means ± SEM. Note that mean values are based on litter means. These data were obtained from a total of 88 pups (49 controls and 39 stress) originating from 14 litters (9 controls and 5 stress). In each panel, the numbers within the bars indicate the number of litters used in each group; the number underneath (in parentheses) indicate the total number of preparations used. *p < 0.05, statistically different from P0 (<18 h old). p < 0.05, statistically different from corresponding control value. #p < 0.05, statistically different from corresponding female value.
Figure 6.
Figure 6.
Effects of GS on circulating levels of corticosterone (A) and testosterone (B) in 4-d-old male and female pups. Values are expressed as means ± SEM, which are based on litter averages. These data were obtained from a total of 104 pups (58 controls and 46 stress) originating from 31 litters (16 controls and 15 stress). In each panel, the numbers underneath the bars indicate the number of litters sampled in each group; the numbers immediately below (in brackets) indicate the total number of pups used in this group. p < 0.05 statistically different from corresponding control value. #p < 0.05, statistically different from corresponding female value.
Figure 7.
Figure 7.
A, Comparison of the V̇e response to moderate hypercapnia (FiCO2 = 0.05; 20 min) between pups born to control dams (gray bars) versus pups born to dams subjected to GS (black bars). fR (B) and Vt (C) components of the response. Data were obtained over the last 5 min of hypercapnia and are expressed as a percentage change from baseline. Values are expressed as means ± SEM based on litter averages. These data were obtained from a total of 85 pups (43 controls and 42 stress) originating from 13 litters (6 controls and 7 stress). In A, the numbers within the bars indicate the number of litters sampled in each group; the numbers below (in parentheses) indicate the total number of pups used in this group. p < 0.05, statistically different from corresponding control value.
Figure 8.
Figure 8.
GS augments the physiological consequences of an apneic event in 4-d-old pups. A, Simultaneous recordings of ventilatory activity (plethysmography; top traces), SpO2, and heart rate (pulse oxymetry; bottom traces) in pups born to control dams (left traces) and pups born to dams subjected to GS (right traces). B, Box plots comparing the proportion of apneas with O2 desaturations and bradycardias in pups born to control (gray box) versus stressed dams (black boxes). C, Box plots comparing the nadir of O2 desaturations and decrease in heart rate during an apnea in each group of pups. These data were obtained from a total of 43 pups (20 controls and 23 stress) originating from 10 litters (4 controls and 6 stress). The numbers below and above the bars (B and C, respectively) indicate the number of litters sampled in each group; the numbers below (in parentheses) indicate the total number of pups used in this group. For details concerning box plots, see Figure 1 legend. p < 0.05, statistically different from corresponding control value.
Figure 9.
Figure 9.
Effects of 5-HT (5 μm) bath application on inspiratory (phrenic) motor output produced by medullary preparation during the neonatal period (P0–P4). Results are compared between preparations from pups born from control dams (gray bars) and pups born from females subjected to stress during gestation (black bars). A, 5-HT reduces the CV of the interburst interval; data from untreated (aCSF) preparations is presented with squares to facilitate comparison. The change in burst frequency after 5-HT application is presented separately for females (B) and males (C). These data are reported as a percentage change from baseline (pre-5-HT). Values are expressed as means ± SEM based on litter averages. These results were obtained from a total of 88 pups (49 controls and 39 stress) originating from 14 litters (9 controls and 5 stress). In each panel, the numbers within the bars indicate the number of litters sampled in each group; the numbers below (in parentheses) indicate the total number of pups used in this group. *p < 0.05, statistically different from P0 (<18 h old). &p < 0.05, statistically different from corresponding aCSF (untreated) value.
Figure 10.
Figure 10.
A, Effects of acute administration of the selective 5-HT1A agonist 8-OH-DPAT (0.05 mg/kg, i.p.) on apnea frequency in developing newborn pups (P0–P4). The effects are compared between pups born to control dams (gray bars) versus pups born to dams subjected to GS (black bars). Measurements were taken 60 min after the injection. The physiological consequences of this treatment were evaluated on P4 with pulse oxymetry to measuring the proportion of apneas with desaturations (B) or bradycardias (C). Because sex-specific effects were significant, males and females are presented separately. Values obtained after saline injection (sham) are reported with square symbols for comparison. Results are expressed as means ± SEM; means are based on litter averages. These data were obtained from a total of 184 pups (89 controls and 95 stress) originating from 27 litters (14 controls and 13 stress). The numbers within the bars (A, C) indicate the number of litters sampled in each group; the numbers below (in parentheses) indicate the total number of pups used in this group. *p < 0.05, statistically different from P0 (<18 h old). p < 0.05, statistically different from corresponding control value. &p < 0.05, statistically different from corresponding saline value.

Similar articles

Cited by

References

    1. Al-Matary A, Kutbi I, Qurashi M, Khalil M, Alvaro R, Kwiatkowski K, Cates D, Rigatto H. Increased peripheral chemoreceptor activity may be critical in destabilizing breathing in neonates. Semin Perinatol. 2004;28:264–272. - PubMed
    1. Azmitia EC, Jr, McEwen BS. Adrenalcortical influence on rat brain tryptophan hydroxylase activity. Brain Res. 1974;78:291–302. - PubMed
    1. Bairam A, Niane LM, Joseph V. Role of ATP and adenosine on carotid body function during development. Respir Physiol Neurobiol. 2012 doi: 10.1016/j.resp.2012.06.016. Advance online publication. Retrieved November 28, 2012. - DOI - PubMed
    1. Baird TM. Clinical correlates, natural history and outcome of neonatal apnoea. Semin Neonatol. 2004;9:205–211. - PubMed
    1. Bissonnette JM. Mechanisms regulating hypoxic respiratory depression during fetal and postnatal life. Am J Physiol Regul Integr Comp Physiol. 2000;278:R1391–R1400. - PubMed

Publication types

MeSH terms