. 2013 Jan 9;33(2):574-86.
doi: 10.1523/JNEUROSCI.0906-12.2013.

Accelerated high-yield generation of limb-innervating motor neurons from human stem cells

Affiliations

Accelerated high-yield generation of limb-innervating motor neurons from human stem cells

Mackenzie W Amoroso et al. J Neurosci. .

Abstract

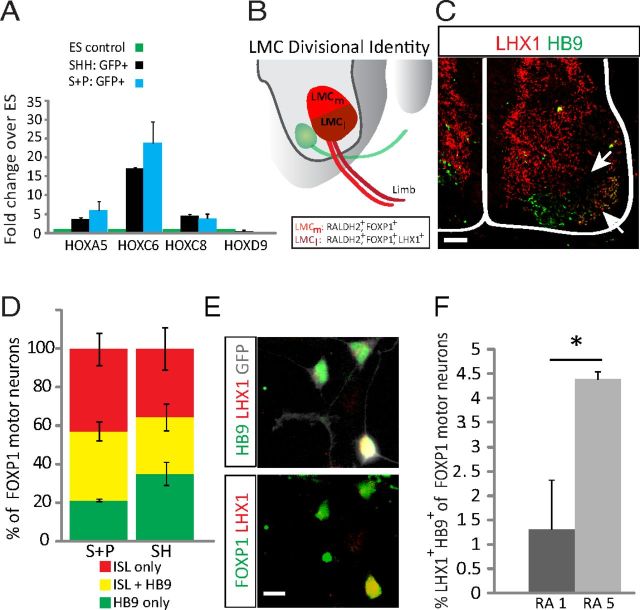
Human pluripotent stem cells are a promising source of differentiated cells for developmental studies, cell transplantation, disease modeling, and drug testing. However, their widespread use even for intensely studied cell types like spinal motor neurons is hindered by the long duration and low yields of existing protocols for in vitro differentiation and by the molecular heterogeneity of the populations generated. We report a combination of small molecules that within 3 weeks induce motor neurons at up to 50% abundance and with defined subtype identities of relevance to neurodegenerative disease. Despite their accelerated differentiation, motor neurons expressed combinations of HB9, ISL1, and column-specific markers that mirror those observed in vivo in human embryonic spinal cord. They also exhibited spontaneous and induced activity, and projected axons toward muscles when grafted into developing chick spinal cord. Strikingly, this novel protocol preferentially generates motor neurons expressing markers of limb-innervating lateral motor column motor neurons (FOXP1(+)/LHX3(-)). Access to high-yield cultures of human limb-innervating motor neuron subtypes will facilitate in-depth study of motor neuron subtype-specific properties, disease modeling, and development of large-scale cell-based screening assays.


Figures

Figure 1.
Figure 1.
Accelerated induction of motor neuron-specific Hb9::GFP expression under optimized S + P conditions. A, Using the Hb9::GFP reporter line, ventralization was assessed from the proportion of the total (DAPI stained) cells that were GFP+. The standard 30 d motor neuron differentiation protocol using 0.1 μm RA was followed. Cells were dissociated and fixed 1 d later (day 31). Testing known Smoothened agonists against the recombinant human protein showed that several agonists, SAG (1 μm) and PUR (1 μm), outperformed the recombinant SHH (200 ng/ml) or HAG (1 μm), although not significantly (one-way ANOVA). B, We tested a 10-fold increase in RA concentration, in combination with SAG 1 μm, and found that 1 μm RA was significantly better. (n = 3, p = 0.013). C, After establishing that there were more motor neurons by day 31 with a high RA concentration (1 μm), we again tested SAG, PUR, and the combination of SAG + PUR (not significant, one-way ANOVA). D, Differentiation schematic showing timing of neuralization from day 0 to 7 with SB431542 at 10 μm and LDN193189 at 0.2 μm, caudalization with RA 1 μm from day 5 onward, and ventralization from day 7 onward with either SAG 1 μm + PUR 1 μm (condition 1) or SHH 200 ng/ml (condition 2). At day 17 additional neurotrophic support was added with GDNF 10 ng/ml, CNTF 10 ng/ml, and IGF-1 10 ng/ml. E, Endogenous live GFP expression in embryoid bodies during differentiation days 5, 14, 21, and 31. F, Differentiation efficiency was quantified using FACS analysis. Cells were dissociated and analyzed at day 0, 7, 14, 21, and 31. FACS analysis of the S + P (green line) and the SHH (red line) culture at the time points specified (n = 3–4 each for S + P, n = 2–4 each for SHH). Asterisks: Day 21 comparison of S + P to SHH, p = 0.001. Day 21 to day 14 for S + P, p = 0.003. G, Representative images showing motor neurons (GFP) and DAPI immunocytochemistry at day 21 and 31 for both the S + P and SHH method. Scale bars: (for E) 100 μm; (for G) 10 μm. Data presented as mean ± SEM.
Figure 2.
Figure 2.
Molecular characterization of human motor neurons in vitro and in vivo. A, At day 21, S + P-derived cultures showing BRN3A in red and GFP in green. B, S + P cultures robustly expressed TUJ1 (TUJ1, red; GFP, green; DAPI, blue). C, Image of S + P-derived motor neurons stained for GFP and SMI-32 at 21 + 14 d in culture. D, Representative images of S + P- and SHH-derived motor neurons (GFP) expressing HB9 and ISL1. E, Percentage of GFP+ motor neurons that express ISL1+ only, HB9+ only, or ISL1+ and HB9+ concurrently. F, Quantification of HB9 and ISL1 expression in vitro using the accelerated S + P protocol (day 21) and the traditional protocol with SHH (day 31) and human in vivo. Values are shown as a percentage of all HB9/ISL1 cells for each of the mutually exclusive categories of HB9+ only, ISL1+ only, or HB9 and ISL1 coexpressed. G, Representative image of human spinal cords from the limb level for DAPI (blue), HB9 (red), and ISL1 (green). Colocalization of HB9 and ISL1 is shown in yellow. H, Representative image of human spinal cords from the nonlimb level for DAPI (blue), HB9 (red), and ISL1 (green). Colocalization of HB9 and ISL1 is shown in yellow. I, Quantification of pan-MN (HB9 + ISL1) from seven additional stem cell lines (n = 2 biological replicates each except for H9, which is n = 3). Scale bars: (for A–D) 15 μm; (for G, H) 100 μm. All images are derived from the Hb9::GFP reporter line. Data presented as mean ± SEM.
Figure 3.
Figure 3.
RNA-Seq analysis of S + P- and SHH-derived motor neurons. A, Normalized reads from GAPDH, neurofilament light chain (NEFL), and ISL1 genes for S + P non-motor neurons (GFP), S + P- and SHH-derived motor neurons (GFP+) post-FACS (HUES3 Hb9::GFP line). Reads are normalized to the total number of map reads per sample. B, Venn diagram of twofold (p < 0.001) enriched genes in S + P motor neurons (MNs) compared with S + P non-MNs (GFP fraction). C, Scatter plot of S + P MNs versus S + P non-MNs; red dots are the 145 genes enriched from B, while the blue are the five down from B. D, The set of cholinergic and MN-specific genes that are upregulated in the S + P motor neuron fraction. E, GO clustering of S + P MNs versus non-MNs yields 37 clusters, of which the top clusters are highlighted. Right side of the chart is the genes from cluster 2, with known motor neuron genes highlighted in yellow; 1–14 on the right corresponds to 1–14 on the left.
Figure 4.
Figure 4.
FOXP1+ motor neurons are generated using the S + P method. A, Representative images of human embryonic spinal cords from both the limb level and nonlimb level for FOXP1 (red), LHX3 (green), and ISL1 (blue). B, Schematic representation of the spinal cord at the limb level showing the MMC (LHX3) and the LMC (RALDH2, FOXP1). C, qPCR showing the log fold change of S + P to SHH-derived purified motor neurons (n = 3, log base 2, *p < 0.05). D, Representative image of SHH- and S + P-derived motor neurons (GFP) with FOXP1 (left) and LHX3 (right) using the Hb9::GFP reporter. E, Quantification of immunostained dissociated cultures using either S + P or SHH (n = 6, *p < 0.001). F, Representative image of FOXP1, SMI-32, and GFP from SHH- and S + P-derived cultures using the Hb9::GFP reporter. G, Quantification from six additional stem cell lines (iPS from ALS patients and controls) showing FOXP1+ motor neurons generated with the S + P method. H, Human spinal cord at 10 weeks, RALDH2 in red with FOXP1 in green. I, RALDH2 expression in a subset of GFP+ neurites; outgrowth from a plated EB (day 21 + 48 h). Arrows indicate a GFP+ neurite without RALDH2 (top left), and an RALDH2+ GFP+ neurite. Scale bars: (for A, H) 100 μm; (for D, F) 10 μm; (for I) 50 μm. Data presented as mean ± SD.
Figure 5.
Figure 5.
LMC diversity generated using the S + P method. A, qPCR data showing the fold change of S + P- and SHH-derived GFP+ FACS purified motor neurons compared with ESCs for HOX genes. B, Schematic representation of the spinal cord at the limb level showing the LMCm (RALDH2, FOXP1) and LMCl (RALDH2, FOXP1, LHX1). C, Human spinal cord at the brachial-limb level for LHX1 (red) and HB9 (green). Top arrow indicates area without LHX1 (the LMCm region), and bottom arrow highlights the LMCl. D, Quantification of FOXP1+ motor neurons for HB9, ISL1, and pan-MN expression from both SHH- and S + P-derived cultures from the Hb9::GFP reporter line. E, Representative image of a GFP+ motor neuron (gray) that expresses HB9, LHX1 (top) and FOXP1, LHX1 (bottom). F, Treatment with RA 5 μm over 3 d showed an increase in LHX1+ FOXP1+ motor neurons (p = 0.036) using the Hb9:GFP reporter. Scale bars: (for C) 100 μm; (for E) 10 μm. Data presented as mean ± SEM.
Figure 6.
Figure 6.
Functional properties of S + P motor neurons. A, Representative image of HUES3 Hb9::GFP motor neurons stained for GFP and FOXP1 post-FACS. B, Quantification of FOXP1, 21 + 14 d. C, Fluorescence intensity recorded over 90 s show spontaneous Ca2+ transients occurred in neurons loaded with Fluo-4 AM Ca2+ indicator. Representative traces of active cells are shown. D, Fluorescence images showing the same field of motor neurons (day 21 + 6) loaded with Fluo-4 Ca2+ indicator before, during, and after KA application. E, Representative trace showing fluorescence intensities measured from a single motor neuron before and after a brief application of 100 μm KA. F, Current-clamp recording obtained from a GFP-positive HUES3 Hb9::GFP cell differentiated using the S + P protocol, day 21 + 7. Three membrane potential traces in response to different amplitudes of current injection are overlaid. The current command step is shown under the membrane traces. The selected traces show the membrane potential in the absence of a current step, a subthreshold current step (8 pA), and a current step sufficient to elicit a train of action potentials (26 pA). G, Representative image of xenotransplantation into a developing chicken embryo. Human Hb9::GFP, green; TUJ1. red. A.U. is arbitrary units. Scale bars: (for A) 25 μm; (for D, G) 50 μm.

Comment in

Similar articles

Cited by

References

    1. Agalliu D, Takada S, Agalliu I, McMahon AP, Jessell TM. Motor neurons with axial muscle projections specified by Wnt4/5 signaling. Neuron. 2009;61:708–720. - PMC - PubMed
    1. Arber S, Han B, Mendelsohn M, Smith M, Jessell TM, Sockanathan S. Requirement for the homeobox gene Hb9 in the consolidation of motor neuron identity. Neuron. 1999;23:659–674. - PubMed
    1. Bock C, Kiskinis E, Verstappen G, Gu H, Boulting G, Smith ZD, Ziller M, Croft GF, Amoroso MW, Oakley DH. Reference maps of human ES and iPS cell variation enable high-throughput characterization of pluripotent cell lines. Cell. 2011;144:439–452. - PMC - PubMed
    1. Boulting GL, Kiskinis E, Croft GF, Amoroso MW, Oakley DH, Wainger BJ, Williams DJ, Kahler DJ, Yamaki M, Davidow L. A functionally characterized test set of human induced pluripotent stem cells. Nat Biotechnol. 2011;29:279–286. - PMC - PubMed
    1. Chambers SM, Fasano CA, Papapetrou EP, Tomishima M, Sadelain M, Studer L. Highly efficient neural conversion of human ES and iPS cells by dual inhibition of SMAD signaling. Nat Biotechnol. 2009;27:275–280. - PMC - PubMed

Publication types

MeSH terms