

doi: 10.1523/JNEUROSCI.3185-12.2013.
Synaptic plasticity at intrathalamic connections via CaV3.3 T-type Ca2+ channels and GluN2B-containing NMDA receptors
Affiliations
- PMID: 23303941
- PMCID: PMC6704895
- DOI: 10.1523/JNEUROSCI.3185-12.2013
Item in Clipboard
Synaptic plasticity at intrathalamic connections via CaV3.3 T-type Ca2+ channels and GluN2B-containing NMDA receptors
J Neurosci.
.
Abstract
The T-type Ca(2+) channels encoded by the Ca(V)3 genes are well established electrogenic drivers for burst discharge. Here, using Ca(V)3.3(-/-) mice we found that Ca(V)3.3 channels trigger synaptic plasticity in reticular thalamic neurons. Burst discharge via Ca(V)3.3 channels induced long-term potentiation at thalamoreticular inputs when coactivated with GluN2B-containing NMDA receptors, which are the dominant subtype at these synapses. Notably, oscillatory burst discharge of reticular neurons is typical for sleep-related rhythms, suggesting that sleep contributes to strengthening intrathalamic circuits.
Figures
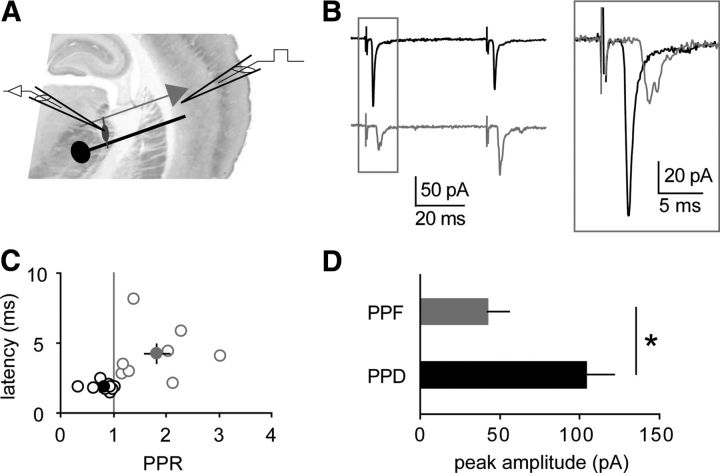
Thalamoreticular versus corticoreticular inputs. A, Scheme of a thalamocortical slice with recording electrode in the nRt and stimulating electrode in cortical layer 6. B, Average EPSCs evoked by two stimuli (50 ms), showing either paired-pulse depression (black) or paired-pulse facilitation (gray). Inset, superimposition of the first peaks reveals different response latencies. C, Plot of latency values versus PPR, indicating that depressant responses (n = 9, black) display shorter latencies than facilitating responses (n = 8, gray; p = 0.01 between groups). Filled circles represent mean values. D, Depressant inputs (PPD) display significantly larger amplitudes than facilitating inputs (PPF). *p < 0.05.
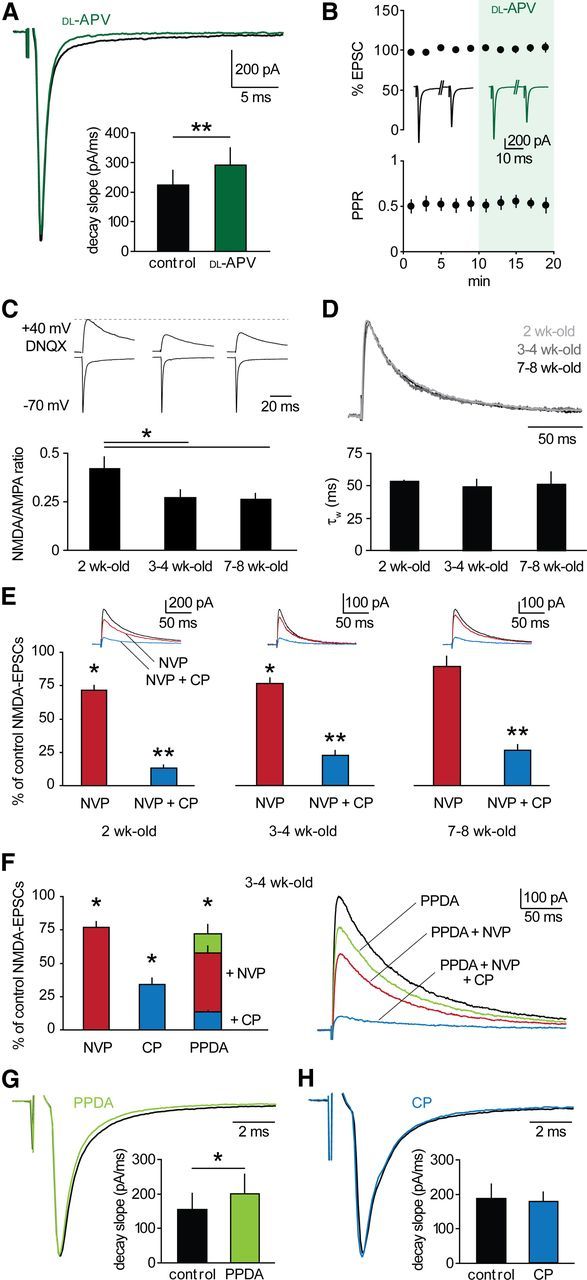
GluN2B-NMDARs dominate at thalamoreticular synapses. A, Thalamoreticular EPSCs in a cell voltage-clamped at −70 mV in control (black) and in the presence of 100 μm
dl -APV (green). NMDAR blockade induced an increase in decay slope (bars; n = 9; p < 0.01). B, NMDAR blockade did not affect EPSC peak and PPR (n = 9, p > 0.05). Inserted traces are average EPSCs in control and in dl -APV. C, Top, examples of AMPAR- and NMDAR-mediated components at −70 mV and +40 mV, respectively. NMDA-EPSCs were isolated with 40 μm DNQX. Bottom, NMDA/AMPA ratio significantly decreased after 2 weeks (2-week-old, n = 9; 3- to 4-week-old, n = 14; 7- to 8-week-old, n = 10, *p < 0.05). D, Top, overlay of scaled NMDA-EPSCs at different developmental stages, coded in gray scale. No change in decay kinetics occurred, as indicated by comparable values of weighted τ (τW) of biexponential fit (bars: 2-week-old, n = 6; 3- to 4-week-old, n = 16; 7- to 8-week-old, n = 6). E, Pharmacological profile of NMDA-EPSCs (2-week-old, n = 6; 3- to 4-week-old, n = 8; 7- to 8-week-old, n = 6). Upper insets, example NMDA-EPSCs showing progressive reduction of control responses (black) after superfusion of NVP (red) and NVP+CP (blue). F, Left, mean effects of GluN2-specific blockers in 3- to 4-week-old mice (NVP, n = 8; CP, n = 8; PPDA, n = 7). Right, example NMDA-EPSCs showing progressive reduction upon blocker superfusion, as indicated. G, H, EPSCs in a cell voltage-clamped at −70 mV in control (black) and in the presence of 500 nm PPDA (G, green) or 10 μm CP (H, blue). GluN2C/D inhibition induced an increase in decay slope (bars; n = 8; p < 0.05), whereas GluN2B blockade had no effect (bars; n = 6; p > 0.05). *p < 0.05, **p < 0.01 drug versus control.
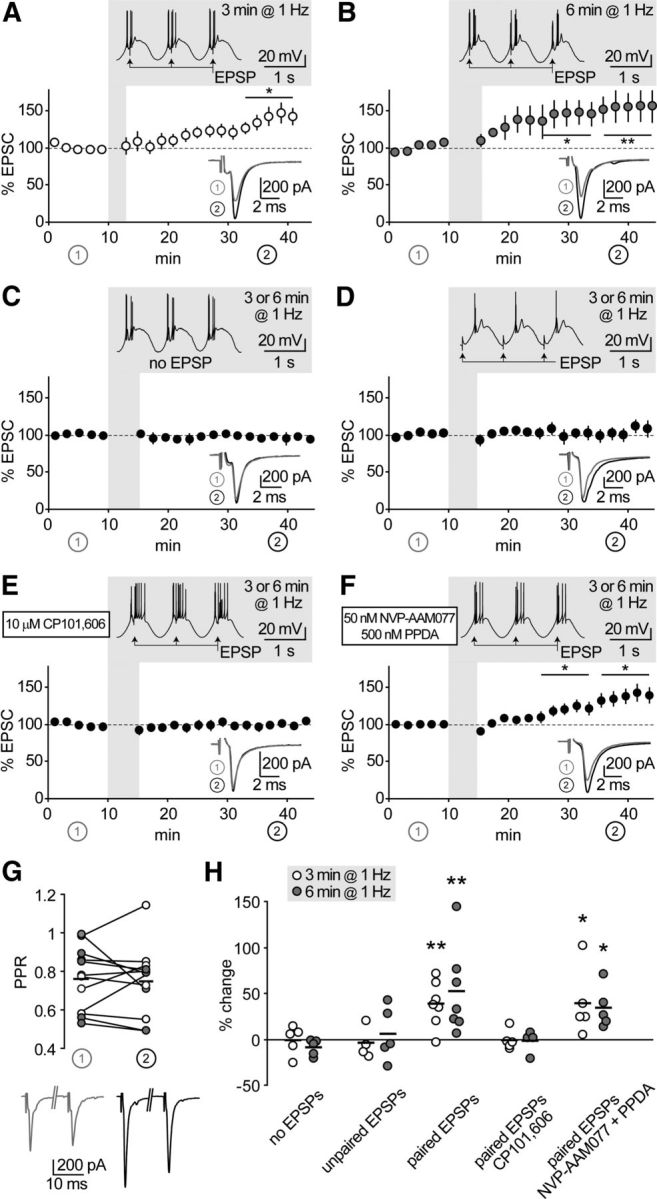
GluN2B-NMDARs mediate thalamoreticular plasticity. A, B, Time course of EPSCs at thalamoreticular synapses. Shadowed insets show pairing protocol applied after 10 min baseline. Low-threshold bursts were paired with synaptic stimulation (EPSP) for 3 min (A, n = 7) or 6 min (B, n = 7), which induced EPSC potentiation. Traces in the lower insets are average EPSCs evoked during baseline (1, gray) and during the last 10 min of recording (2, black). *p < 0.05, **p < 0.01 baseline versus end of recording. C–F, Same representation as in A and B. Synaptic potentiation was not induced when EPSPs were omitted (C, n = 10), or not paired with bursts (D, n = 9). Pairing-induced plasticity was prevented by GluN2B-NMDAR blockade with CP (E, n = 9), but not by inhibition of GluN2A and GluN2C/D with NVP and PPDA (F, n = 10). G, Potentiation was not accompanied by significant changes in PPR, as tested at the beginning of baseline (1) and at the end of the recording (2) in a subset of cells from A and B. H, Summary of data presented in A–F. Short horizontal lines represent means from series with 3 min (white circles) and 6 min (gray circles) oscillations. Asterisks represent significant difference from the corresponding “no EPSP” series (one-way ANOVA on log-transformed values, followed by post hoc Student's t test; *p < 0.05, **p < 0.01).
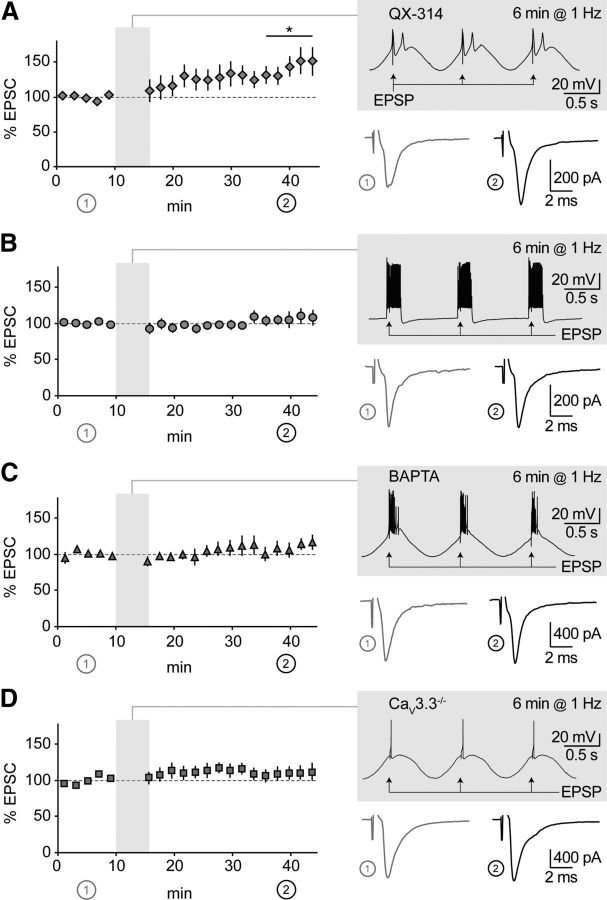
CaV3.3 channels are required for thalamoreticular plasticity. A, Time course of EPSCs in nRt cells patched with a solution containing 0.5 mm QX-314 (n = 7). Shadowed insets show pairing protocols applied after 10 min baseline, with examples of average EPSCs during baseline (1) and at the end of recording (2). During induction, low-threshold bursts were largely preserved, while action potentials were blocked, which resulted in significant potentiation (n = 7). B, Same representation as in A. Sinusoidal current injections were replaced by squared current pulses applied to nRt cell held at −60 mV, to promote tonic firing over low-threshold bursting. No change in synaptic efficacy was induced (n = 8). C, D, Same representation as in A. Suppression of burst-induced Ca2+ with intracellular BAPTA (n = 6) and in CaV3.3−/− mice (n = 8) prevented potentiation. *p < 0.05 baseline versus end of recording.
Similar articles
-
Impaired transmission at corticothalamic excitatory inputs and intrathalamic GABAergic synapses in the ventrobasal thalamus of heterozygous BDNF knockout mice.Neuroscience. 2012 Oct 11;222:215-27. doi: 10.1016/j.neuroscience.2012.07.005. Epub 2012 Jul 13. Neuroscience. 2012. PMID: 22796079
-
Synaptic organization and input-specific short-term plasticity in anterior cingulate cortical neurons with intact thalamic inputs.Eur J Neurosci. 2007 May;25(9):2847-61. doi: 10.1111/j.1460-9568.2007.05485.x. Eur J Neurosci. 2007. PMID: 17561847
-
Control of Homeostatic Synaptic Plasticity by AKAP-Anchored Kinase and Phosphatase Regulation of Ca2+-Permeable AMPA Receptors.J Neurosci. 2018 Mar 14;38(11):2863-2876. doi: 10.1523/JNEUROSCI.2362-17.2018. Epub 2018 Feb 13. J Neurosci. 2018. PMID: 29440558 Free PMC article.
-
[The role of cluster receptor state in synaptic plasticity].Zh Vyssh Nerv Deiat Im I P Pavlova. 2008 May-Jun;58(3):276-93. Zh Vyssh Nerv Deiat Im I P Pavlova. 2008. PMID: 18689239 Review. Russian.
-
Hippocampal long-term synaptic plasticity and signal amplification of NMDA receptors.Crit Rev Neurobiol. 2006;18(1-2):71-84. doi: 10.1615/critrevneurobiol.v18.i1-2.80. Crit Rev Neurobiol. 2006. PMID: 17725510 Review.
Cited by
-
Contribution of S4 segments and S4-S5 linkers to the low-voltage activation properties of T-type CaV3.3 channels.PLoS One. 2018 Feb 23;13(2):e0193490. doi: 10.1371/journal.pone.0193490. eCollection 2018. PLoS One. 2018. PMID: 29474447 Free PMC article.
-
Sleep slow wave-related homo and heterosynaptic LTD of intrathalamic GABAAergic synapses: involvement of T-type Ca2+ channels and metabotropic glutamate receptors.J Neurosci. 2015 Jan 7;35(1):64-73. doi: 10.1523/JNEUROSCI.2748-14.2015. J Neurosci. 2015. PMID: 25568103 Free PMC article.
-
Maturational Stage-Dependent Contributions of the Cav3.2 T-Type Calcium Channel to Dentate Gyrus Granule Cell Excitability.eNeuro. 2025 Apr 4;12(4):ENEURO.0423-24.2025. doi: 10.1523/ENEURO.0423-24.2025. Print 2025 Apr. eNeuro. 2025. PMID: 40068874 Free PMC article.
-
A novel mechanism for short-term post-tetanic plasticity in thalamocortical neurons.Brain Res. 2025 Jul 15;1859:149654. doi: 10.1016/j.brainres.2025.149654. Epub 2025 Apr 21. Brain Res. 2025. PMID: 40268039
-
Long-term effects of a double hit murine model for schizophrenia on parvalbumin expressing cells and plasticity-related molecules in the thalamic reticular nucleus and the habenula.Transl Psychiatry. 2024 Oct 24;14(1):450. doi: 10.1038/s41398-024-03166-6. Transl Psychiatry. 2024. PMID: 39448557 Free PMC article.
References
-
- Agmon A, Connors BW. Thalamocortical responses of mouse somatosensory (barrel) cortex in vitro. Neuroscience. 1991;41:365–379. - PubMed
-
- Auberson YP, Allgeier H, Bischoff S, Lingenhoehl K, Moretti R, Schmutz M. 5-Phosphonomethylquinoxalinediones as competitive NMDA receptor antagonists with a preference for the human 1A/2A, rather than 1A/2B receptor composition. Bioorg Med Chem Lett. 2002;12:1099–1102. - PubMed
-
- Borgland SL, Taha SA, Sarti F, Fields HL, Bonci A. Orexin A in the VTA is critical for the induction of synaptic plasticity and behavioral sensitization to cocaine. Neuron. 2006;49:589–601. - PubMed
Publication types
MeSH terms
Substances
LinkOut - more resources
Full Text Sources
Other Literature Sources
Molecular Biology Databases
Miscellaneous