

A common optimization principle for motor execution in healthy subjects and parkinsonian patients
- PMID: 23303945
- PMCID: PMC6704928
- DOI: 10.1523/JNEUROSCI.1482-12.2013
A common optimization principle for motor execution in healthy subjects and parkinsonian patients
Abstract
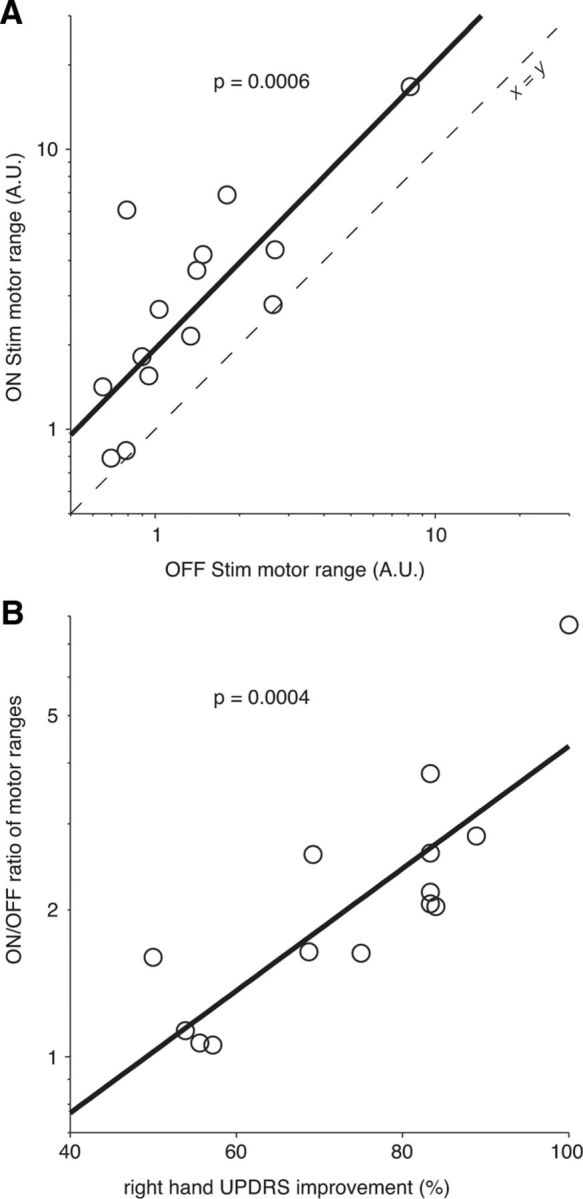
Recent research on Parkinson's disease (PD) has emphasized that parkinsonian movement, although bradykinetic, shares many attributes with healthy behavior. This observation led to the suggestion that bradykinesia in PD could be due to a reduction in motor motivation. This hypothesis can be tested in the framework of optimal control theory, which accounts for many characteristics of healthy human movement while providing a link between the motor behavior and a cost/benefit trade-off. This approach offers the opportunity to interpret movement deficits of PD patients in the light of a computational theory of normal motor control. We studied 14 PD patients with bilateral subthalamic nucleus (STN) stimulation and 16 age-matched healthy controls, and tested whether reaching movements were governed by similar rules in these two groups. A single optimal control model accounted for the reaching movements of healthy subjects and PD patients, whatever the condition of STN stimulation (on or off). The choice of movement speed was explained in all subjects by the existence of a preset dynamic range for the motor signals. This range was idiosyncratic and applied to all movements regardless of their amplitude. In PD patients this dynamic range was abnormally narrow and correlated with bradykinesia. STN stimulation reduced bradykinesia and widened this range in all patients, but did not restore it to a normal value. These results, consistent with the motor motivation hypothesis, suggest that constrained optimization of motor effort is the main determinant of movement planning (choice of speed) and movement production, in both healthy and PD subjects.
Figures
Similar articles
-
Beta-band oscillations in the supplementary motor cortex are modulated by levodopa and associated with functional activity in the basal ganglia.Neuroimage Clin. 2018 May 18;19:559-571. doi: 10.1016/j.nicl.2018.05.021. eCollection 2018. Neuroimage Clin. 2018. PMID: 29984164 Free PMC article.
-
Bilateral subthalamic stimulation effects on oral force control in Parkinson's disease.J Neurol. 2003 Feb;250(2):179-87. doi: 10.1007/s00415-003-0966-7. J Neurol. 2003. PMID: 12574948 Clinical Trial.
-
Subthalamic nucleus stimulation for Parkinson disease: benefits observed in levodopa-intolerant patients.J Neurosurg. 2001 Aug;95(2):213-21. doi: 10.3171/jns.2001.95.2.0213. J Neurosurg. 2001. PMID: 11780890 Clinical Trial.
-
Evolving concepts on bradykinesia.Brain. 2020 Mar 1;143(3):727-750. doi: 10.1093/brain/awz344. Brain. 2020. PMID: 31834375 Free PMC article. Review.
-
New strategies in motor parkinsonism.Parkinsonism Relat Disord. 2007;13 Suppl 3:S446-9. doi: 10.1016/S1353-8020(08)70047-6. Parkinsonism Relat Disord. 2007. PMID: 18267281 Review.
Cited by
-
A Computational Model of Deep Brain Stimulation for Parkinson's Disease Tremor and Bradykinesia.Brain Sci. 2024 Jun 20;14(6):620. doi: 10.3390/brainsci14060620. Brain Sci. 2024. PMID: 38928620 Free PMC article.
-
The Thermodynamic Consequences of Parkinson's Disease.Front Neurol. 2021 Aug 26;12:685314. doi: 10.3389/fneur.2021.685314. eCollection 2021. Front Neurol. 2021. PMID: 34512508 Free PMC article. Review.
-
Limited encoding of effort by dopamine neurons in a cost-benefit trade-off task.J Neurosci. 2013 May 8;33(19):8288-300. doi: 10.1523/JNEUROSCI.4619-12.2013. J Neurosci. 2013. PMID: 23658169 Free PMC article.
-
Better get back to work: a role for motor beta desynchronization in incentive motivation.J Neurosci. 2014 Jan 1;34(1):1-9. doi: 10.1523/JNEUROSCI.1711-13.2014. J Neurosci. 2014. PMID: 24381263 Free PMC article. Clinical Trial.
-
Commentary: Dopamine-Dependent Loss Aversion during Effort-Based Decision-Making.Front Neurosci. 2020 May 13;14:468. doi: 10.3389/fnins.2020.00468. eCollection 2020. Front Neurosci. 2020. PMID: 32528243 Free PMC article. No abstract available.
References
-
- Azulay JP, Mesure S, Amblard B, Blin O, Sangla I, Pouget J. Visual control of locomotion in Parkinson's disease. Brain. 1999;122:111–120. - PubMed
-
- Ballanger B, Thobois S, Baraduc P, Turner RS, Broussolle E, Desmurget M. “Paradoxical kinesis” is not a hallmark of Parkinson's disease but a general property of the motor system. Mov Disord. 2006;21:1490–1495. - PubMed
-
- Baroni A, Benvenuti F, Fantini L, Pantaleo T, Urbani F. Human ballistic arm abduction movements: effects of L-dopa treatment in Parkinson's disease. Neurology. 1984;34:868–876. - PubMed
-
- Benjamini Y, Heller R. Screening for partial conjunction hypotheses. Biometrics. 2008;64:1215–1222. - PubMed
Publication types
MeSH terms
Substances
LinkOut - more resources
Full Text Sources
Other Literature Sources