. 2013 Jan 9;33(2):678-86.
doi: 10.1523/JNEUROSCI.1404-12.2013.

LTP-induced long-term stabilization of individual nascent dendritic spines

Affiliations

LTP-induced long-term stabilization of individual nascent dendritic spines

Travis C Hill et al. J Neurosci. .

Abstract

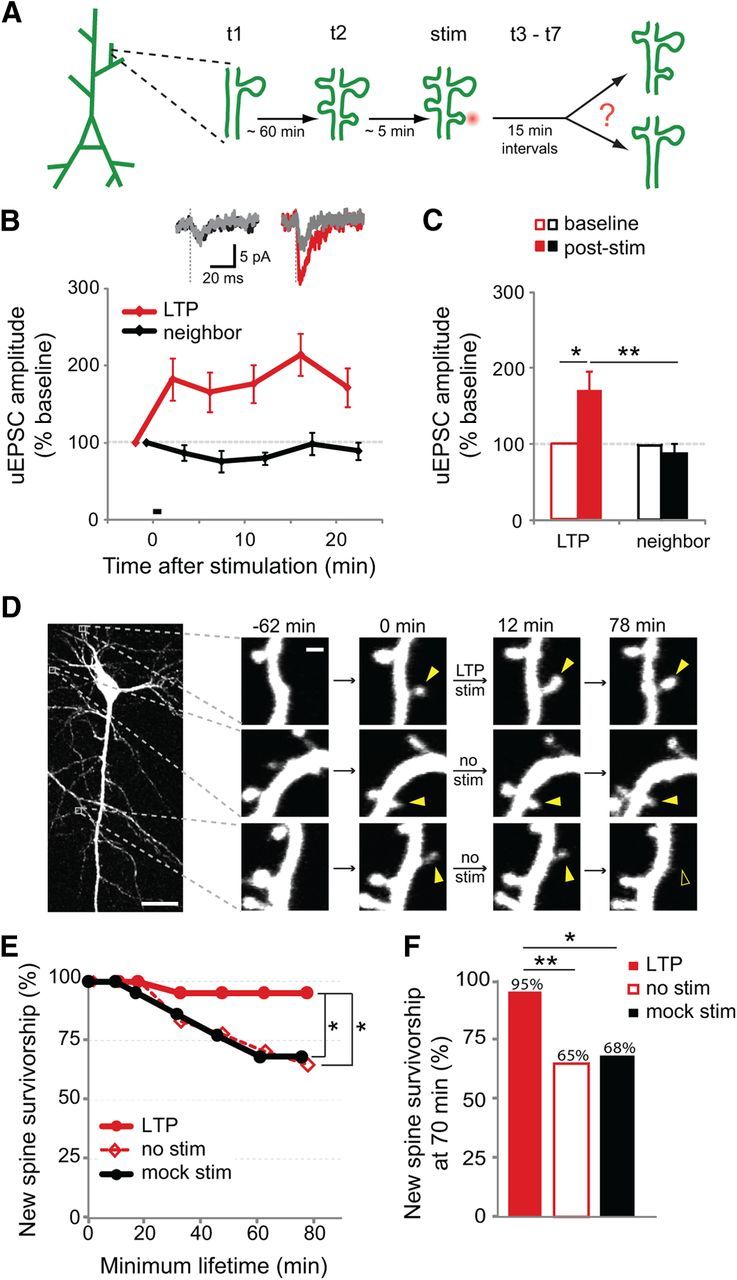
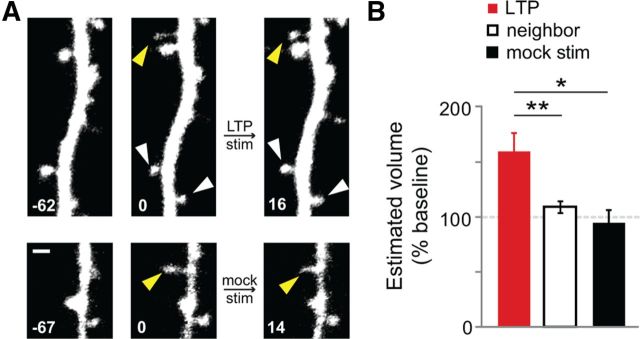
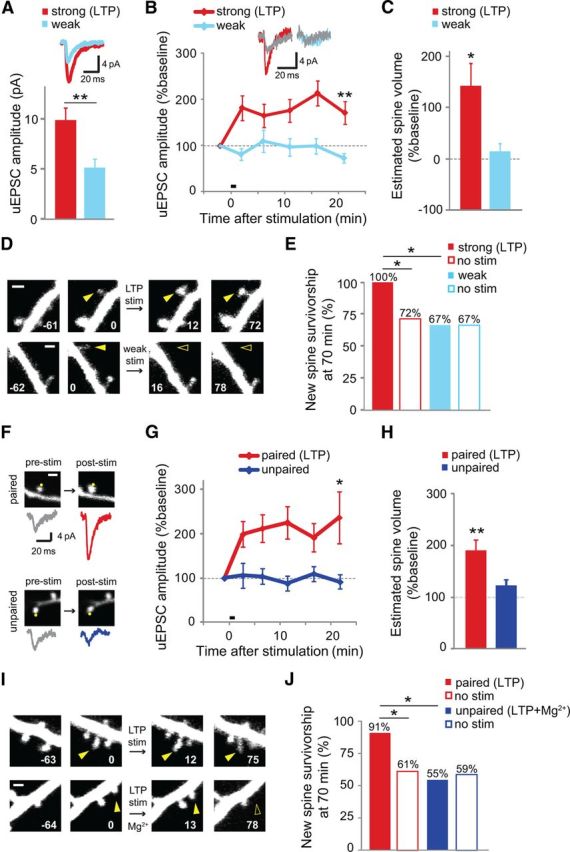
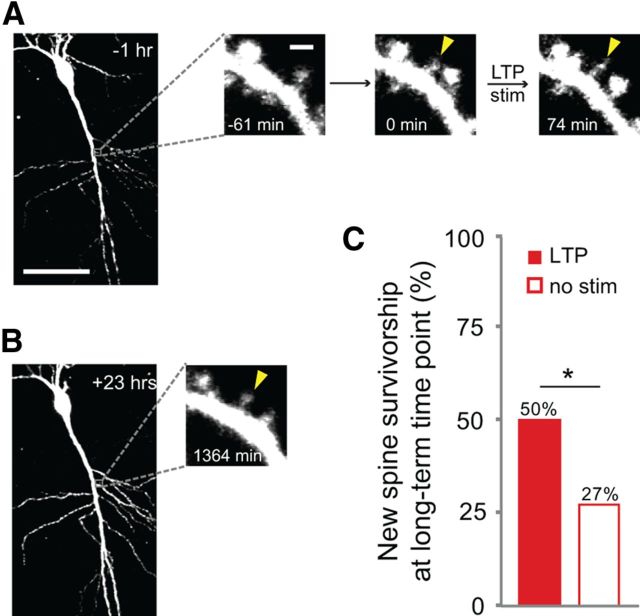
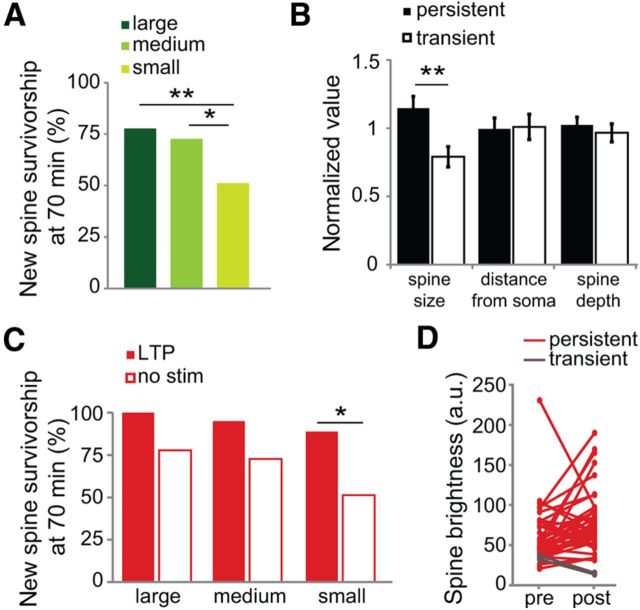
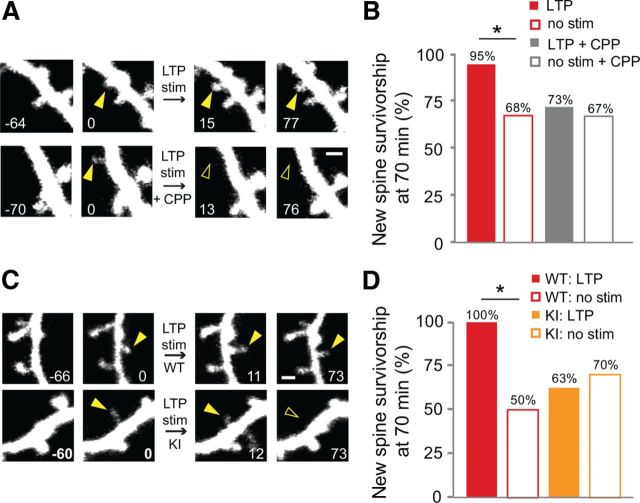
Learning new tasks has been associated with increased growth and stabilization of new dendritic spines. We examined whether long-term potentiation (LTP), a key cellular mechanism thought to underlie learning, plays a role in selective stabilization of individual new spines during circuit plasticity. Using two-photon glutamate uncaging, we stimulated nascent spines on dendrites of rat hippocampal CA1 neurons with patterns that induce LTP and then monitored spine survival rates using time-lapse imaging. Remarkably, we found that LTP-inducing stimuli increased the long-term survivorship (>14 h) of individual new spines. Activity-induced new spine stabilization required NMDA receptor activation and was specific for stimuli that induced LTP. Moreover, abrogating CaMKII binding to the NMDA receptor abolished activity-induced new spine stabilization. Our findings demonstrate for the first time that, in addition to enhancing the efficacy of preexisting synapses, LTP-inducing stimuli promote the transition of nascent spines from a short-lived, transient state to a longer-lived, persistent state.


Figures

Figure 1.
Figure 1.
Survivorship of new spines increases in response to LTP-inducing stimuli. A, The experimental design: time-lapse imaging (t1 and t2) to identify new spines was followed by stimulation of an individual new spine using two-photon glutamate uncaging (stim) and then time-lapse imaging (t3– t7) to monitor spine stability. For display purposes, three new spines are shown here on the same dendritic segment (two unstimulated and one stimulated); however, in our data multiple new spines rarely appeared in close proximity on the same dendritic segment. B, The LTP-inducing stimulus (30 pulses at 0.5 Hz paired with postsynaptic depolarization to 0 mV) increased the uEPSC amplitude of stimulated spines (red) but not of neighboring spines (black; p < 0.05 at all poststimulus time points; 12 cells). Inset shows representative traces (mean of 5–7 trials) from individual spines during baseline (gray) and 20 min after uncaging stimulation. C, Twenty minutes after LTP induction, the uEPSC of the stimulated spine (filled red bar) was increased over baseline (open red bar; p < 0.05; paired t test) and also compared to that of the neighboring spine (filled black bar; p < 0.01; unpaired t test). D, An EGFP-transfected CA1 pyramidal neuron in organotypic slice culture (P7 + 9 DIV) and examples of three new spines (solid yellow arrowheads), one of which was selected for stimulation. One unstimulated new spine retracted (open yellow arrowhead). Scale bars, 25 μm (whole cell image); 1 μm (dendrite images). E, The LTP-inducing stimulus (30 pulses at 0.5 Hz in nominal Mg2+) increased the survivorship of stimulated new spines (solid red circles; 21 spines) as compared to unstimulated new spines on the same cells (open red diamonds; 54 spines; p < 0.05, log-rank test) or mock-stimulated new spines (solid black circles; 22 spines; p < 0.05, log-rank test). F, New spine survivorship at 70 min was increased following LTP stimulus (solid red bar) as compared to unstimulated new spines on the same cells (open red bar; p < 0.01, Barnard's exact test) or mock-stimulated new spines (solid black bar; p < 0.05, Barnard's exact test).
Figure 2.
Figure 2.
New spines enlarge in response to LTP-inducing stimuli. A, New spines (solid yellow arrowheads at 0 min) and unstimulated neighboring spines (solid white arrowheads) on cells exposed to LTP stimulation (LTP stim) or mock stimulation (mock stim). Scale bar, 1 μm. B, A significant enlargement was observed for new spines stimulated with the LTP stimulus (solid red bar; 42 spines), as compared to unstimulated neighboring spines on the same cells (open black bar; 84 spines; p < 0.01, t test) or mock stimulated new spines (solid black bar, 21 spines; p < 0.05, t test).
Figure 3.
Figure 3.
Uncaging-induced new spine stabilization is specific to LTP-inducing stimuli. A, uEPSCs evoked by the weak stimulus (blue; 2.5 mm MNI-glutamate; 5.1 ± 0.9 pA; 15 spines, 3 cells) were smaller than those evoked by the strong (LTP) stimulus (red; 3.5 mm MNI-glutamate; 9.9 ± 1.2 pA; 20 spines, 4 cells; p < 0.01). Inset shows average uEPSC trace from each condition. B, The weak stimulus did not induce LTP (blue; 13 spines, 13 cells), in contrast to the strong (LTP) stimulus, which did induce LTP (red; data from Fig. 1B). Inset shows representative traces (mean of 5–7 trials) from individual spines during baseline (gray) and 20 min after uncaging stimulation for the strong (red) and weak (blue) stimuli. C, No significant spine enlargement was observed at the first time point (∼5 min) after the weak stimulus (blue; 8 spines; p > 0.37), whereas the strong stimulus caused spine enlargement (red; 12 spines; p < 0.05, t test). D, New spines (solid yellow arrowheads at 0 min) on cells exposed to strong (LTP stim) or weak stimulation. Time stamps are in min. Scale bar = 1 μm. E, No increase in new spine survivorship was observed in response to the weak stimulus (solid blue bar; 6 spines) over unstimulated new spines (open blue bar; 18 spines; p > 0.9, Barnard's exact test). As expected, new spine survivorship increased following the strong (LTP) stimulus (solid red bar; 12 spines) over that of unstimulated new spines (open red bar; 13 spines; p < 0.05, Barnard's exact test). F, Images of spines and corresponding uEPSC traces before (pre-stim) and 20 min after (post-stim) delivery of the uncaging stimulus when paired with depolarization to 0 mV (paired) or held at −70 mV (unpaired). Scale ba, 1 μm. G, Pairing stimulation with depolarization to 0 mV resulted in robust potentiation of the uEPSC amplitude of the target spine (red; 26 spines, 26 cells), whereas potentiation was not observed in the unpaired condition (blue; 14 spines, 14 cells). H, Spines in the pairing condition (red; 26 spines, 26 cells) exhibited significant and persistent enlargement compared to baseline and compared to spines in the unpaired condition (blue; 14 spines, 14 cells) 20 min after stimulation. I, New spines (solid yellow arrowheads at 0 min) on cells exposed to the LTP stimulation in the absence or presence of Mg2+. J, New spines exposed to the LTP stimulus in the absence of Mg2+ (LTP; solid red bar; 11 spines, 11 cells) were significantly more stable than unstimulated new spines on the same cells (no stim; open red bar; 59 spines, 11 cells; p < 0.05, Barnard's exact test). In the presence of Mg2+, the uncaging stimulus had no effect on the stability of stimulated new spines (LTP + Mg2+; solid blue bar; 11 spines, 11 cells) compared with unstimulated new spines on those same cells (no stim; open blue bar; 58 spines, 11 cells; p > 0.4, Barnard's exact test).
Figure 4.
Figure 4.
LTP-induced new spine stabilization is long lasting. A, A new spine (solid yellow arrowhead at 0 min) was stimulated with the LTP stimulus (LTP stim). Scale bars, 50 μm (whole cell image); 1 μm (dendrite images). B, After incubation overnight in culture medium, the new spine (solid yellow arrowhead) was still present. C, Even at the long-term time point (≥ 14 h), survivorship of stimulated new spines (solid red bar; 22 spines) was significantly higher than that of unstimulated new spines on the same cells (open red bar; 63 spines; p < 0.05, Pearson's χ2 test).
Figure 5.
Figure 5.
Larger new spines show enhanced survivorship rates. A, Survivorship of medium and large new spines is significantly higher than that of small new spines (p < 0.01, Pearson's χ2 < 36 a.u. = small, 41 spines, 26 cells; 36–60 a.u. = medium, 33 spines, 22 cells; >60 a.u. = large, 36 spines, 23 cells). B, Initial spine size of persistent new spines (open bars) is larger than that of transient new spines (solid bars; p < 0.01, unpaired t test; 60 persistent, 50 transient spines, 37 cells). Distance from the soma (p = 0.9) and spine depth in the slice (p = 0.5) were not different between the two groups. All values are relative to the mean. C, Survivorship of small stimulated (solid bars) new spines is higher than that of small unstimulated (open bars) new spines (p < 0.05, Barnard's exact test; bin sizes and unstimulated (no stim) spine numbers as in A; stimulated: small, 9 spines, 9 cells; medium, 20 spines, 20 cells; large, 13 spines, 13 cells). D, Volume of new spines before (pre) and after (post) stimulation to illustrate volume change of persistent (red lines; 40 spines on 40 cells) and transient (gray lines; 2 spines on 2 cells) new spines.
Figure 6.
Figure 6.
NMDAR activation and interaction of NMDARs with CaMKII are required for LTP-induced new spine stabilization. A, New spines (solid yellow arrowheads at 0 min) were stimulated in the absence (LTP stim) or presence (LTP stim + CPP) of CPP. Time stamps are in minutes. Scale bar, 1 μm. B, In the presence of CPP, no significant increase in survivorship was observed for stimulated new spines (solid gray bar; 22 spines) over unstimulated new spines (open gray bar; 43 spines; p = 0.4, Barnard's exact test). As expected, in the absence of CPP, survivorship of stimulated new spines (solid red bar; 21 spines) increased as compared to that of unstimulated new spines (open red bar; 56 spines; p < 0.05, Barnard's exact test). C, New spines (solid yellow arrowheads at 0 min) on dendrites from CA1 neurons in hippocampal slice cultures from WT and GluN2B L1298/R1300Q knock-in mice (KI) were stimulated with the uncaging LTP stimulus (LTP stim). Time stamps are in minutes. D, No significant increase in survivorship was observed in GluN2B KI mice for stimulated new spines (solid orange bar; 8 spines) over unstimulated new spines (open orange bar; 30 spines; p = 0.4, Barnard's exact test). As expected, survivorship of stimulated new spines (solid red bar; 6 spines) increased in WT mice as compared to unstimulated new spines (open red bar; 30 spines; p < 0.02).

Similar articles

Cited by

References

    1. Bailey CH, Alberini C, Ghirardi M, Kandel ER. Molecular and structural changes underlying long-term memory storage in Aplysia. Adv Second Messenger Phosphoprotein Res. 1994;29:529–544. - PubMed
    1. Barria A, Malinow R. NMDA receptor subunit composition controls synaptic plasticity by regulating binding to CaMKII. Neuron. 2005;48:289–301. - PubMed
    1. Bingol B, Wang CF, Arnott D, Cheng D, Peng J, Sheng M. Autophosphorylated CaMKIIalpha acts as a scaffold to recruit proteasomes to dendritic spines. Cell. 2010;140:567–578. - PubMed
    1. Bosch M, Hayashi Y. Structural plasticity of dendritic spines. Curr Opin Neurobiol. 2012;22:383–388. - PMC - PubMed
    1. Bourne JN, Harris KM. Coordination of size and number of excitatory and inhibitory synapses results in a balanced structural plasticity along mature hippocampal CA1 dendrites during LTP. Hippocampus. 2011;21:354–373. - PMC - PubMed

Publication types

MeSH terms

Substances

LinkOut - more resources