

Global dysrhythmia of cerebro-basal ganglia-cerebellar networks underlies motor tics following striatal disinhibition
- PMID: 23303948
- PMCID: PMC6704907
- DOI: 10.1523/JNEUROSCI.4018-12.2013
Global dysrhythmia of cerebro-basal ganglia-cerebellar networks underlies motor tics following striatal disinhibition
Abstract
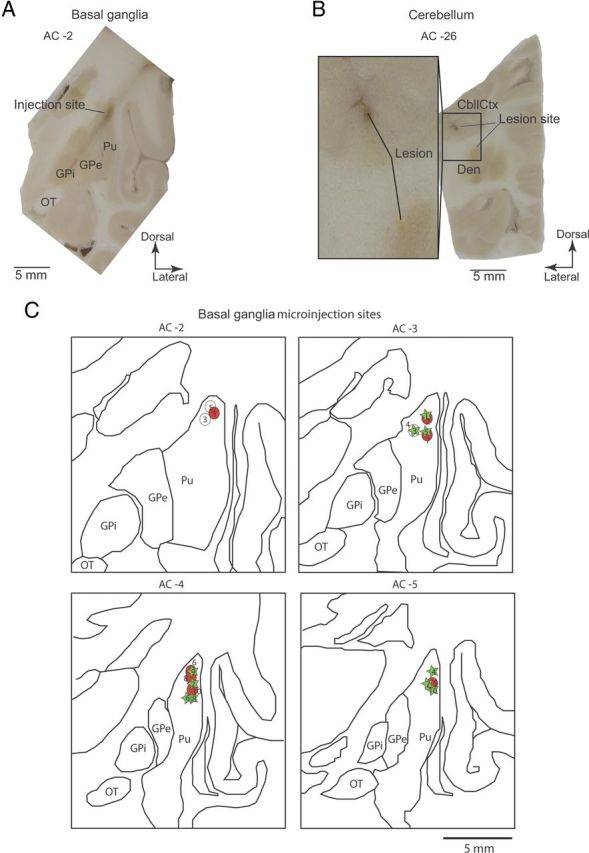
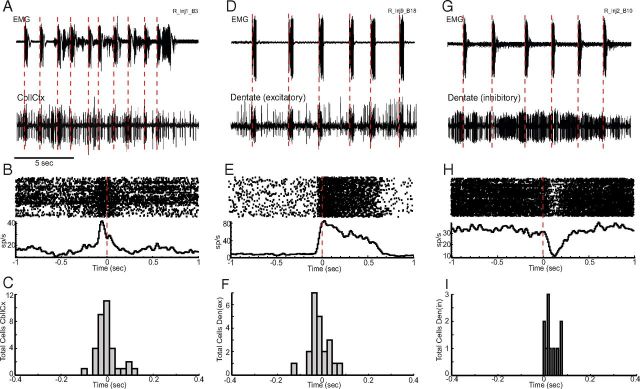
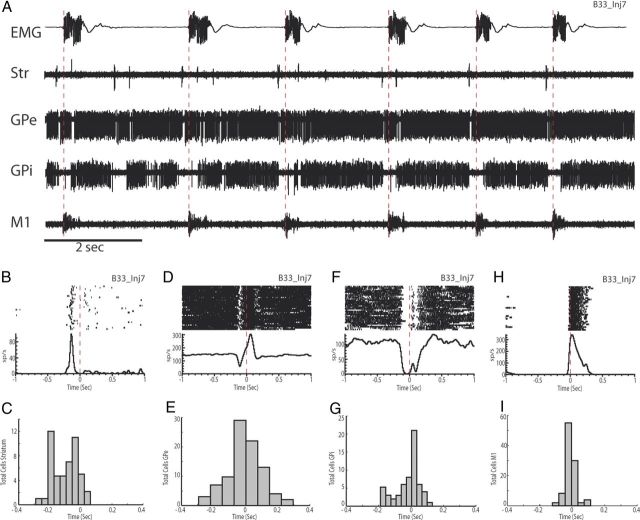
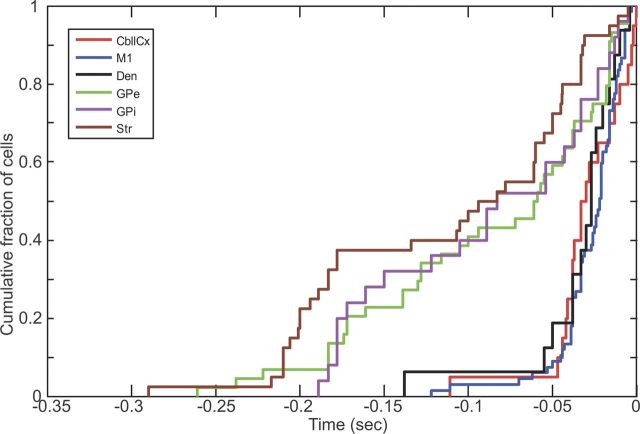
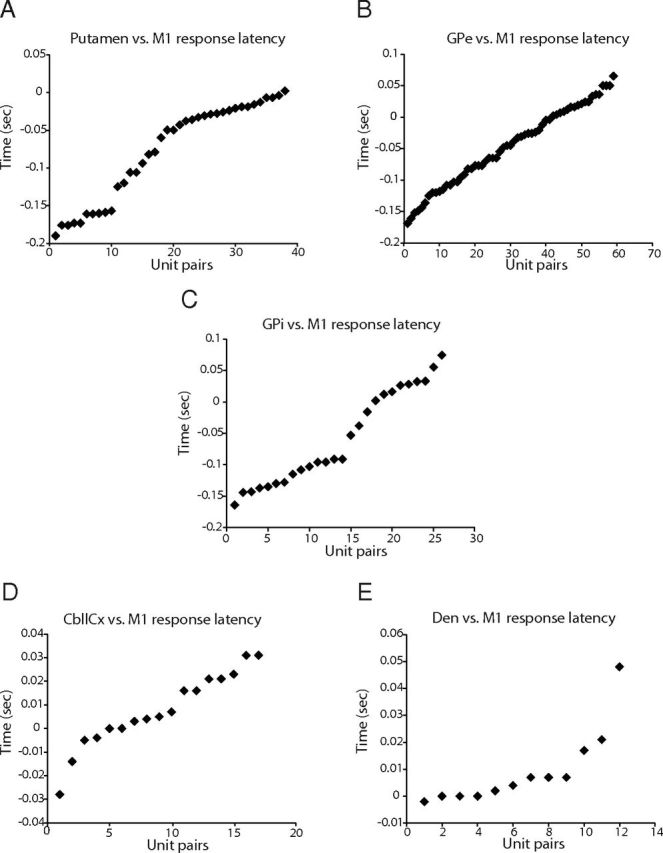
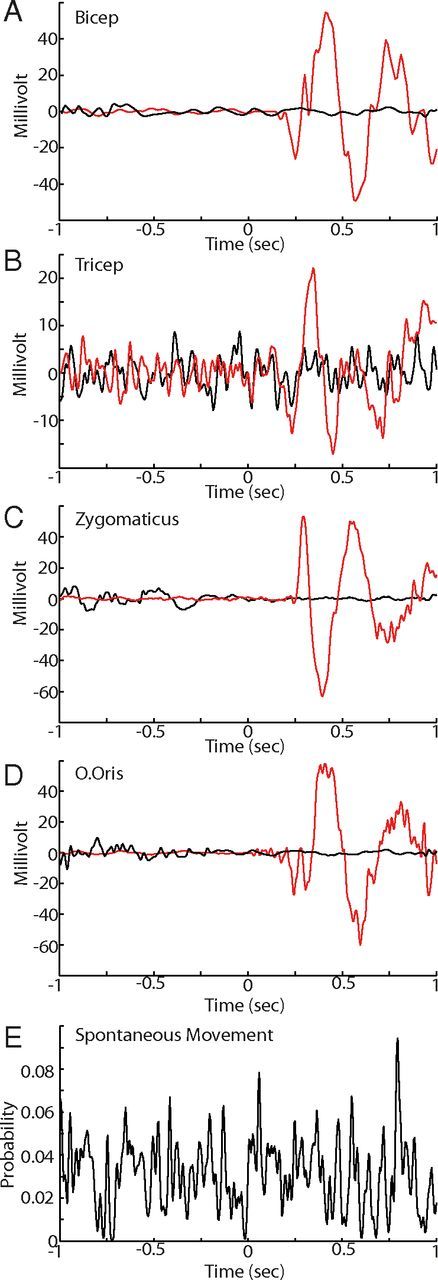
Motor tics, a cardinal symptom of Tourette syndrome (TS), are hypothesized to arise from abnormalities within cerebro-basal ganglia circuits. Yet noninvasive neuroimaging of TS has previously identified robust activation in the cerebellum. To date, electrophysiological properties of cerebellar activation and its role in basal ganglia-mediated tic expression remain unknown. We performed multisite, multielectrode recordings of single-unit activity and local field potentials from the cerebellum, basal ganglia, and primary motor cortex using a pharmacologic monkey model of motor tics/TS. Following microinjections of bicuculline into the sensorimotor putamen, periodic tics occurred predominantly in the orofacial region, and a sizable number of cerebellar neurons showed phasic changes in activity associated with tic episodes. Specifically, 64% of the recorded cerebellar cortex neurons exhibited increases in activity, and 85% of the dentate nucleus neurons displayed excitatory, inhibitory, or multiphasic responses. Critically, abnormal discharges of cerebellar cortex neurons and excitatory-type dentate neurons mostly preceded behavioral tic onset, indicating their central origins. Latencies of pathological activity in the cerebellum and primary motor cortex substantially overlapped, suggesting that aberrant signals may be traveling along divergent pathways to these structures from the basal ganglia. Furthermore, the occurrence of tic movement was most closely associated with local field potential spikes in the cerebellum and primary motor cortex, implying that these structures may function as a gate to release overt tic movements. These findings indicate that tic-generating networks in basal ganglia mediated tic disorders extend beyond classical cerebro-basal ganglia circuits, leading to global network dysrhythmia including cerebellar circuits.
Figures


Similar articles
-
The neurophysiological correlates of motor tics following focal striatal disinhibition.Brain. 2009 Aug;132(Pt 8):2125-38. doi: 10.1093/brain/awp142. Epub 2009 Jun 8. Brain. 2009. PMID: 19506070
-
Dysfunctions of the basal ganglia-cerebellar-thalamo-cortical system produce motor tics in Tourette syndrome.PLoS Comput Biol. 2017 Mar 30;13(3):e1005395. doi: 10.1371/journal.pcbi.1005395. eCollection 2017 Mar. PLoS Comput Biol. 2017. PMID: 28358814 Free PMC article.
-
Corticostriatal Divergent Function in Determining the Temporal and Spatial Properties of Motor Tics.J Neurosci. 2015 Dec 16;35(50):16340-51. doi: 10.1523/JNEUROSCI.2770-15.2015. J Neurosci. 2015. PMID: 26674861 Free PMC article.
-
Tic disorders: what happens in the basal ganglia?Neuroscientist. 2013 Feb;19(1):101-8. doi: 10.1177/1073858412444466. Epub 2012 May 16. Neuroscientist. 2013. PMID: 22596263 Review.
-
Neuroimaging of tic genesis: Present status and future perspectives.Mov Disord. 2015 Aug;30(9):1179-83. doi: 10.1002/mds.26333. Mov Disord. 2015. PMID: 26377151 Review.
Cited by
-
An Update on the Diagnosis and Management of Tic Disorders.Ann Indian Acad Neurol. 2023 Nov-Dec;26(6):858-870. doi: 10.4103/aian.aian_724_23. Epub 2023 Nov 29. Ann Indian Acad Neurol. 2023. PMID: 38229610 Free PMC article.
-
Addressing the Complexity of Tourette's Syndrome through the Use of Animal Models.Front Neurosci. 2016 Apr 8;10:133. doi: 10.3389/fnins.2016.00133. eCollection 2016. Front Neurosci. 2016. PMID: 27092043 Free PMC article. Review.
-
Merging the Pathophysiology and Pharmacotherapy of Tics.Tremor Other Hyperkinet Mov (N Y). 2019 Jan 9;8:595. doi: 10.7916/D8H14JTX. eCollection 2018. Tremor Other Hyperkinet Mov (N Y). 2019. PMID: 30643668 Free PMC article. Review.
-
Modeling tics in rodents: Conceptual challenges and paths forward.J Neurosci Methods. 2017 Dec 1;292:12-19. doi: 10.1016/j.jneumeth.2017.02.007. Epub 2017 Feb 22. J Neurosci Methods. 2017. PMID: 28237575 Free PMC article. Review.
-
Alterations in the microstructure of white matter in children and adolescents with Tourette syndrome measured using tract-based spatial statistics and probabilistic tractography.Cortex. 2018 Jul;104:75-89. doi: 10.1016/j.cortex.2018.04.004. Epub 2018 Apr 12. Cortex. 2018. PMID: 29758375 Free PMC article.
References
-
- Albin RL, Mink JW. Recent advances in Tourette syndrome research. Trends Neurosci. 2006;29:175–182. - PubMed
-
- Allen GI, Tsukahara N. Cerebrocerebellar communication systems. Physiol Rev. 1974;54:957–1006. - PubMed
-
- Bohlhalter S, Goldfine A, Matteson S, Garraux G, Hanakawa T, Kansaku K, Wurzman R, Hallett M. Neural correlates of tic generation in Tourette syndrome: an event-related functional MRI study. Brain. 2006;129:2029–2037. - PubMed
Publication types
MeSH terms
Substances
LinkOut - more resources
Full Text Sources
Other Literature Sources