. 2013 Jan 9;33(2):734-47.
doi: 10.1523/JNEUROSCI.4390-12.2013.

Characterization of sacral interneurons that mediate activation of locomotor pattern generators by sacrocaudal afferent input

Affiliations

Characterization of sacral interneurons that mediate activation of locomotor pattern generators by sacrocaudal afferent input

Alex Etlin et al. J Neurosci. .

Abstract

Identification of the neural pathways involved in retraining the spinal central pattern generators (CPGs) by afferent input in the absence of descending supraspinal control is feasible in isolated rodent spinal cords where the locomotor CPGs are potently activated by sacrocaudal afferent (SCA) input. Here we study the involvement of sacral neurons projecting rostrally through the ventral funiculi (VF) in activation of the CPGs by sensory stimulation. Fluorescent labeling and immunostaining showed that VF neurons are innervated by primary afferents immunoreactive for vesicular glutamate transporters 1 and 2 and by intraspinal neurons. Calcium imaging revealed that 55% of the VF neurons were activated by SCA stimulation. The activity of VF neurons and the sacral and lumbar CPGs was abolished when non-NMDA receptors in the sacral segments were blocked by the antagonist CNQX. When sacral NMDA receptors were blocked by APV, the sacral CPGs were suppressed, VF neurons with nonrhythmic activity were recruited and a moderate-drive locomotor rhythm developed during SCA stimulation. In contrast, when the sacral CPGs were activated by SCA stimulation, rhythmic and nonrhythmic VF neurons were recruited and the locomotor rhythm was most powerful. The activity of 73 and 27% of the rhythmic VF neurons was in-phase with the ipsilateral and contralateral motor output, respectively. Collectively, our studies indicate that sacral VF neurons serve as a major link between SCA and the hindlimb CPGs and that the ability of SCA to induce stepping can be enhanced by the sacral CPGs. The nature of the ascending drive to lumbar CPGs, the identity of subpopulations of VF neurons, and their potential role in activating the locomotor rhythm are discussed.


Figures

Figure 1.
Figure 1.
Studies of sacral neurons with rostral projections through the VF. A, Schematic cross section through the S2 segment of the spinal cord. VF, VLF, LF, DLF, and DF are ventral, ventrolateral, lateral, dorsolateral, and dorsal funiculi, respectively. B, Illustration of the isolated en bloc spinal cord preparation is shown with the recording electrodes from the left and right S2 and L2 ventral roots. The first coccygeal dorsal root (Co1) is stimulated to produce the rhythm. A hyphenated line indicates the lumbosacral junction (L6–S1). C, Primary afferent innervation of VF neurons. Retrograde labeling of VF neurons through cut VF axon bundles at the lumbosacral or the S1–S2 junction (red) and anterograde labeling of contralateral afferents entering the sacral cord through the S3 dorsal root (cyan) by different fluorophores. The en bloc spinal cord preparation is shown with ventral side up. Vibratome cross sections of the fixed preparation were immunostained for VGluT1 or VGluT2 to determine a possible glutamatergic innervation of VF neurons by SCA, as described in Figures 2, 3, and 4.
Figure 2.
Figure 2.
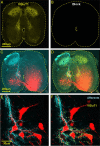
Primary afferent VGluT1-immunoreactive innervation of VF neurons. A, B, The confocal micrograph in A demonstrates specific immunostaining for VGluT1 (yellow) in a cross section through the S2 segment, which is completely eliminated by pretreatment with the blocking peptide of the primary VGluT1 antibodies (B). C, Low-power projected confocal micrographs of a 50-μm cross section cut through the S2 segment of the spinal cord shows VF neurons retrogradely labeled through the left VF at the S1–S2 level (red) and anterogradely filled sacral afferents (cyan) labeled via the contralateral S3 dorsal root. D, The labeled VF neurons and afferents displayed in C are shown after VGluT1 immunostaining (yellow). E, F, High-power (original magnification × 60), single optical slice micrographs of the VF neurons in the area framed in D are shown in E and F. E, VF neurons and afferents. F, VF neurons contacted by primary afferent boutons IR for VGluT1 (yellow). Fluorophores: VF, cascade blue dextran (pseudo-color, red); afferents, Texas red dextran (pseudo-color, cyan); and VGluT1, Cy5.
Figure 3.
Figure 3.
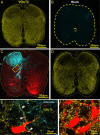
Primary afferent and intraspinal VGluT2 IR innervation of VF neurons. A, B, The confocal micrograph in A visualizes the specific immunostaining for VGluT2 (yellow) in a cross section through the S2 segment, which is completely abolished by pretreatment with the blocking peptide of the primary VGluT2 antibodies (B). C, Low-power projected confocal micrographs of a 50-μm cross section cut through the S2 segment of the spinal cord shows VF neurons retrogradely labeled through the left VF at the S1–S2 level (red) and anterogradely filled sacral afferents (cyan) labeled via the contralateral (right) S3 dorsal root. D, The low-power cross section displayed in C is shown after VGluT2 immunostaining (yellow). E, High-power (original magnification × 60), single-slice micrograph of the area framed in C shows a VF neuron (pseudo color, red), which is contacted (e.g., arrowheads) by primary afferent boutons (pseudo color, cyan) with VGluT2 IR (yellow). Fluorophores: VF, Cascade blue dextran; Afferents, Texas red dextran; and VGluT2, Cy5. F, High-power (original magnification × 60) view of a single optical slice micrograph of a group of S2 VF neurons back-labeled in a different double labeling experiment followed by immunostaining for VGluT2. The neurons are innervated by VGluT2 IR boutons but are not contacted by SCA.
Figure 4.
Figure 4.
Primary afferent VGluT1 and VGluT2 innervation of VF neurons. A, B, Side-by-side display of single-slice high-power confocal micrographs of cross sections through S2 (in two different experiments), showing putative VGluT1 (A) and VGluT2 (B) synaptic contacts between SCA and VF neurons. The sections are triple-labeled with fluorescent probes and shown in pseudo-colors: red, VF neuron; green, afferents; and blue, VGluTs. (1) Contacts of afferents with the VF neurons (yellow, merge of green on red). (2) Contacts of VGluTs with VF neurons (magenta, merge of blue on red). The magnified views taken from the regions confined within the squares in A and B, respectively, are examples of the colocalizations of contacts on the VF neuron with the afferent (3), the VGluTs (4), and both (5, cyan). Optical slice thickness: A, 0.76; B, 1 μm. Scale bars, 1 μm.
Figure 5.
Figure 5.
The rhythmic output produced by graded stimulation of higher-threshold SCA is modulated by the concurrently stimulated proprioceptive input. A, Illustration of the experimental setup used in this series (left). The motor output recorded from the left and right ventral roots of S2 and L2 is produced by stimulus trains delivered at different intensities to two branches of a split Co1 dorsal root while recording the incoming afferent volleys from the undivided proximal part of Co1. Branch I is stimulated at Group I-II strength (red), whereas the stimulation of Branch II was set to exceed the threshold for activation of Aδ fibers (blue). The two branches are stimulated separately or simultaneously (right scheme). B, The motor output produced by stimulus train of Branch I at 3.6 μA, Branch II at 9 μA, and both branches (Branch I + II) was recorded from the left and right ventral roots of S2 and L2; 50-pulse 3.3-Hz stimulus trains were applied in each case. C, Coherent cross-power density plots of the left versus right L2 time series obtained for the rhythm produced by Branch II and Branch I + II are shown on the left. The high-power frequency bands (delineated with white and black lines in the left and right spectra, respectively) were divided into 5 consecutive bins (Etlin et al., 2010) to extract the mean power of the conditioned (Branch I + II, gray bars) and the unconditioned (Branch II, black bars) responses as a function of time (C1). C2, Mean ± SD of the power obtained in a different experiment performed under identical conditions, before (black) and after (gray) conditioning with proprioceptive afferents. Note the more moderate effect of proprioceptive conditioning on the motor output in this case. Two-way ANOVA followed by multiple-comparison tests using the modified Tukey's method revealed significant differences between the conditioned and unconditioned coherent power for each of the 5 bins in histogram C1 (p < 0.007) and for the first and fifth bin in histogram C2 (p < 0.04).
Figure 6.
Figure 6.
The activity of VF neurons and its correlation to the concurrent motor output are used to evaluate the involvement VF neurons in sensory activation of the CPGs. A, A single VF neuron, in the right S2 segment, back-labeled with Calcium green dextran from cut VF axon bundles at the contralateral (left) lumbosacral junction and imaged from the ventral surface of the en bloc spinal cord, is shown before (A1, reference image) and during SCA stimulation (A2, maximal difference image). The neuron is outlined by a white line and encircled by 10 regions of interest used to measure the out-of-focus fluorescence. The graph (A3) presents the mean pixel intensity of the neuron (black) and the encircling ROIs (red) calculated from a five frame average taken before the stimulus train. Arrow indicates the rostral direction. B, The relative fluorescence changes (ΔF/F) of the neuron (black) and the encircling ROIs (red) during the stimulus train are shown in B1. The specific ΔF/F of the neuron (blue, B3) was calculated by subtracting the mean ΔF/F of the encircling ROIs (red, B2) from that of the neuron (black, B2). C, The rhythm produced by stimulation of the Co1 dorsal root and recorded from the left and right ventral roots of S2 and L2 is superimposed with the interpolated ΔF/F of the imaged neuron, as shown in C1. The coherent cross-power density plot of the activity recorded from the right S2 ventral root versus the ΔF/F of the imaged neuron is shown in C2. The mean R-vector in the circular inset plot, which was calculated from the high-power frequency band delineated by the black line, shows that both rhythms (right VF neuron and right S2 ventral root) are in phase. Stimulation parameters: 40-pulse 3-Hz train applied at 9 μA. Imaging was at 27 fps, the fluorescence excitation at 488 nm, and emission measured at 530 ± 15 nm. This figure describes the strategy of the series of experiments combining fluorescence and electrical activity measurements.
Figure 7.
Figure 7.
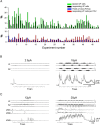
Imaging of sacral VF neurons during low-intensity and higher-intensity SCA stimulation. A, Summary plot of the imaging experiments performed in the present work. Top histogram: Number of the labeled VF neurons (green) and of those responding to SCA stimulation (black) in each of the 48 experiments performed in this series. Bottom histogram: In each experiment, the number of the fields of view from which VF neurons were imaged (blue) and the number of responding VF neurons per field of view (red). B, The activity pattern optically recorded from a left S2 VF neuron back-labeled from the right VF during 50-pulse, 5-Hz stimulus trains applied to the Co1 dorsal root at 2.5 and 10 μA. The motor output was recorded simultaneously from the left and right ventral roots of S2 and L2. C, The activity patterns of 3 different VF neurons at the left S2 labeled through the right VF during 50-pulse, 3-Hz stimulus trains applied to the Co1 dorsal root at 12 and 20 μA. The motor output was recorded from the left and right ventral roots of S2 and L2. Note the different activity patterns produced during the higher intensity stimulus trains in B and C and the low level activity during the lower-intensity stimulation.
Figure 8.
Figure 8.
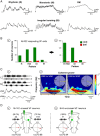
The activity patterns and phase preference of sacral VF neurons during SCA stimulation. A, Activity patterns of VF neurons (ΔF/F) during SCA stimulation. Top, bottom: VF cells with typical rhythmic (R), monotonic (M), monotonic with superimposed oscillations (RM), and irregular bursting (IB, 3 examples) patterns of activity. Stimulation parameters: Co1 dorsal root stimulation, R: 40-pulse 3-Hz train at 9 μA; M: 40-pulse 3.3-Hz train at 16 μA; RM: 30-pulse 3.3-Hz train at 12 μA; IB (left): 40-pulse 2.5-Hz train at 10 μA; IB (middle): 60-pulse 4-Hz train at 30 μA; IB (right): 40-pulse 2.5-Hz train at 12 μA. B, Distribution of the types of activity patterns exhibited by VF neurons labeled ipsilateral (red) or contralateral (green) to the injection site of the calcium sensor is shown before (B1) and after (B2) pooling the R and M group into a combined R + RM group used for subsequent analyses of the phase preference of rhythmic VF neurons. C, Differential phase preference of VF neurons during SCA. Relative fluorescence changes in two VF neurons (VF1 and VF2) at the right S2 are shown with the concurrently recorded motor output from the left and right S2 and L2 ventral roots during SCA stimulation (C1). The coherent cross-power density spectra (C2) show that VF1 and VF2 were in phase with the right and left S2 activity, respectively. The high-power frequency bands of the two spectra are delineated with black lines, and the phase plots are shown in the respective insets (C2). Stimulus train: 40 pulse 3 Hz at 9 μA. The neurons were back-labeled through the right VF at the lumbosacral junction. D, An illustrated summary of the phase preferences of VF neurons that exhibit oscillatory drive (R + RM group) with crossed projections (D1) and uncrossed projections (D2). The circular plots show the phase with the motor output either ipsilateral or contralateral to the somata of the labeled VF neurons.
Figure 9.
Figure 9.
Activation of sacral VF neurons and the thoracolumbar CPGs depends on non-NMDA receptor-mediated synaptic transmission in the sacrocaudal segments of the cord. A, The activity of sacral VF neurons during stimulation of the Co1 dorsal root is shown with the motor output recorded from the left and right S2 and L2 ventral roots, before (Control) and 12 min after (Rostral CNQX) addition of the non-NMDA receptor antagonist CNQX (10 μm) to the thoracolumbar compartments of a dual-chamber experimental bath. Stimulus train: 40-pulse 2.5 Hz at 12 μA. B, In a different experiment, similar recordings (as in A) were done before (Control) and 8 min after (Caudal CNQX) bath application of CNQX to the sacrocaudal compartment. Stimulus train: 50-pulse 2.5 Hz at 10 μA. Note the acceleration of the sacral rhythm and the oscillatory drive of the VF neurons as the lumbar rhythm was blocked (A), and the total elimination of the activity of VF neurons, the sacral and lumbar activity when the sacral segments were exposed to CNQX (B). A, B, The neurons are right-S2 neurons back-labeled from the contralateral VF at the lumbosacral junction.
Figure 10.
Figure 10.
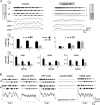
The involvement of rhythmic and nonrhythmic VF neurons and the sacral CPGs in sensory activation of the hindlimb CPGs. A, The activity of VF neurons and the motor output recorded from the left and right ventral roots of S2 and L2 during 40-pulse 5-Hz stimulus trains applied to the Co1 dorsal roots at 12 μA, are shown before (1; Control) and 15 min after (1; Caudal APV) application of the NMDA receptor antagonist APV (20 μm) to the sacral segments in a dual-chamber experimental bath. The top 2 histograms (A2) show the normalized power of the motor rhythm (mean ± SD), produced by SCA stimulation and recorded from the left and right ventral roots of S2 and L2 before (A2; Control, black bars) and after addition of APV to the sacral compartment (A2; APV, gray bars). The mean power for each pair of time series (L vs R S2, and L vs R L2) was calculated at the beginning, middle, and end of the train (epochs 1, 2, and 3, respectively). A3, The mean ± SD of the normalized auto-power of the ΔF/F of the 3 imaged neurons (VF 1, 2, and 3) under these conditions. The normalized cross-power and auto-power values were calculated from the high-power frequency bands of the respective cross-power and auto-power density plots obtained by WT analyses after coherence test and 95% significance test of a χ2 power distribution, respectively (for further details, see Results). B, The rhythmic activity from an RM-type VF neuron and the motor output recorded from the left and right S2 and L2 ventral roots during stimulation of the Co1 dorsal root are shown before (Control), 20 min after addition of APV to the sacral segments (Caudal APV), 35 min after APV wash (APV wash), 10 min after addition of 10 μm CNQX to the sacral segments (Caudal CNQX), and 60 min after CNQX wash (CNQX wash). Hyphenated lines indicate trains. Note that the rhythmic response of the VF cells is attenuated by APV, recovers when APV is washed, and all the activities are abolished by CNQX. Stimulation parameters: 50-pulse 2.5-Hz trains were applied at 10 μA. A, B, The neurons studied are right-S2 neurons back-labeled from the contralateral VF at the lumbosacral junction.

Similar articles

Cited by

References

    1. Alvarez FJ, Villalba RM, Zerda R, Schneider SP. Vesicular glutamate transporters in the spinal cord, with special reference to sensory primary afferent synapses. J Comp Neurol. 2004;472:257–280. - PubMed
    1. Arshavsky YI, Deliagina TG, Orlovsky GN. Pattern generation. Curr Opin Neurobiol. 1997;7:781–789. - PubMed
    1. Blivis D, Mentis GZ, O'Donovan MJ, Lev-Tov A. Differential effects of opioids on sacrocaudal afferent pathways and central pattern generators in the neonatal rat spinal cord. J Neurophysiol. 2007;97:2875–2886. - PubMed
    1. Bonnot A, Whelan PJ, Mentis GZ, O'Donovan MJ. Spatiotemporal pattern of motoneuron activation in the rostral lumbar and the sacral segments during locomotor-like activity in the neonatal mouse spinal cord. J Neurosci. 2002;22:RC203. - PMC - PubMed
    1. Bonnot A, Mentis GZ, Skoch J, O'Donovan MJ. Electroporation loading of calcium-sensitive dyes into the CNS. J Neurophysiol. 2005;93:1793–1808. - PubMed

Publication types

MeSH terms

Substances

LinkOut - more resources