

On the Dielectric Boundary in Poisson-Boltzmann Calculations
- PMID: 23304097
- PMCID: PMC3538373
- DOI: 10.1021/ct700319x
On the Dielectric Boundary in Poisson-Boltzmann Calculations
Abstract
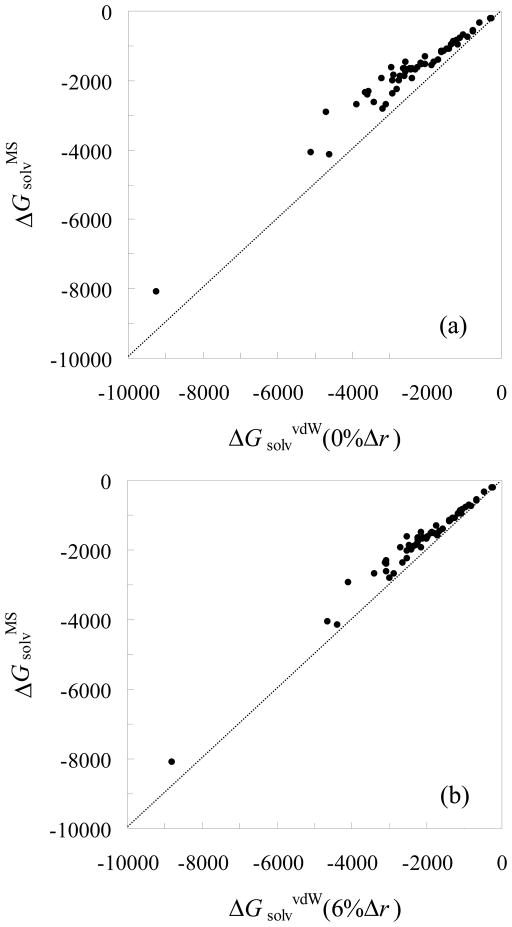
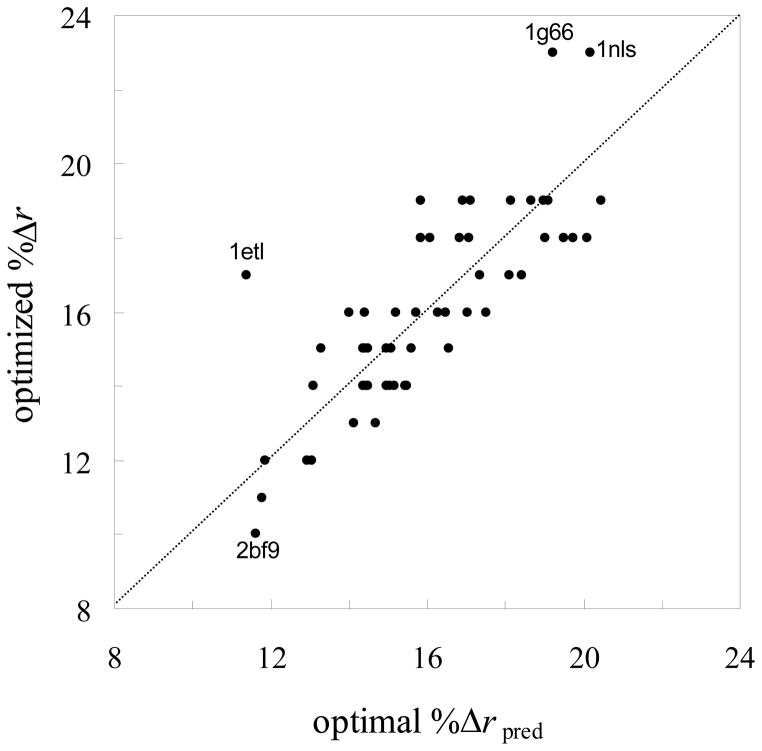
In applying the Poisson-Boltzmann (PB) equation for calculating the electrostatic free energies of solute molecules, an open question is how to specify the boundary between the low-dielectric solute and the high-dielectric solvent. Two common specifications of the dielectric boundary, as the molecular surface (MS) or the van der Waals (vdW) surface of the solute, give very different results for the electrostatic free energy of the solute. With the same atomic radii, the solute is more solvent-exposed in the vdW specification. One way to resolve the difference is to use different sets of atomic radii for the two surfaces. The radii for the vdW surface would be larger in order to compensate for the higher solvent exposure. Here we show that radius re-parameterization required for bringing MS-based and vdW-based PB results to agreement is solute-size dependent. The difference in atomic radii for individual amino acids as solutes is only 2-5% but increases to over 20% for proteins with ~200 residues. Therefore two sets of radii that yield identical MS-based and vdW-based PB results for small solutes will give very different PB results for large solutes. This finding raises issues about two common practices. The first is the use of atomic radii, which are parameterized against either experimental solvation data or data obtained from explicit-solvent simulations on small compounds, for PB calculations on proteins. The second is the parameterization of vdW-based generalized Born models against MS-based PB results.
Figures


References
-
- Gilson MK, Sharp KA, Honig B. Calculating the electrostatic potential of molecules in solution: method and error assessment. J Comput Chem. 1987;9:327–335.
-
- Gilson MK, Honig B. Calculation of the total electrostatic energy of a macromolecular system: solvation energies, binding energies, and conformational analysis. Proteins. 1988;4:7–18. - PubMed
-
- Nicholls A, Honig B. A rapid finite difference algorithm, utilizing successive over-relaxation to solve the Poisson-Boltzmann equation. J Comput Chem. 1991;12:435–445.
-
- Madura JD, Briggs JM, Wade R, Davis ME, Luty BA, Ilin A, Antosiewicz J, Gilson MK, Bagheri B, Scott LR, McCammon JA. Electrostatic and diffusion of molecules in solution: simulations with the University of Houston Brownian Dynamics program. Comput Phys Commun. 1995;91:57–95.
-
- Nina M, Im W, Roux B. Optimized atomic radii for protein continuum electrostatics solvation forces. Biophys Chem. 1999;78:89–96. - PubMed
Grants and funding
LinkOut - more resources
Full Text Sources