. 2012:2012:596394.
doi: 10.1155/2012/596394. Epub 2012 Dec 9.

Expression Pattern of Peroxisome Proliferator-Activated Receptors in Rat Hippocampus following Cerebral Ischemia and Reperfusion Injury

Affiliations

Expression Pattern of Peroxisome Proliferator-Activated Receptors in Rat Hippocampus following Cerebral Ischemia and Reperfusion Injury

Hong Wang et al. PPAR Res. 2012.

Abstract

The present study was designed to investigate the pattern of time-dependent expression of peroxisome proliferator-activated receptors (PPARα, β, and γ) after global cerebral ischemia and reperfusion (I/R) damage in the rat hippocampus. Male Sprague Dawley (SD) rats were subjected to global cerebral I/R. The rat hippocampi were isolated to detect the expression of PPARs mRNA and protein levels at 30 min-30 d after I/R by RT-PCR and Western blot analysis, respectively. The expression levels of PPARs mRNA and protein in the rat hippocampus significantly increased and peaked at 24 h for PPARα and γ (at 48 h for PPARβ) after I/R, then gradually decreased, and finally approached control levels on d 30. The present results suggest that global cerebral I/R can cause obvious increases of hippocampal PPARs mRNA and protein expression within 15 d after I/R. These findings may help to guide the experimental and clinical therapeutic use of PPARs agonists against brain injury.


Figures

Figure 1
Figure 1
Morphological change of rat hippocampal neurons induced by I/R. (a) Representative pictures of H&E stained CA1 section, 400x. Scale bars = 50 μm. (b) Group data showing the cell death rate. **P < 0.01 compared with vehicle sham group (n = 3).
Figure 2
Figure 2
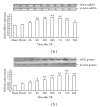
Time-dependent expression of SOD2 in global cerebral I/R rat hippocampus (n = 4). (a) The relative mRNA level of SOD2 was normalized to endogenous β-actin mRNA for each sample. (b) The relative protein level of SOD2 was normalized to endogenous β-actin protein for each sample. Dates are expressed as mean ± SD of four individual experiments. **P < 0.01 compared with sham group; *P < 0.05 compared with sham group.
Figure 3
Figure 3
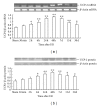
Time-dependent expression of UCP2 in global cerebral I/R rat hippocampus (n = 4). (a) The relative mRNA level of UCP2 was normalized to endogenous β-actin mRNA for each sample. (b) The relative protein level of UCP2 was normalized to endogenous β-actin protein for each sample. Dates are expressed as mean ± SD of four individual experiments. **P < 0.01 compared with sham group, *P < 0.05 compared with sham group.
Figure 4
Figure 4
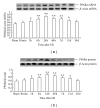
Time-dependent expression of PPARα in global cerebral I/R rat hippocampus (n = 4). (a) The relative mRNA level of PPARα was normalized to endogenous β-actin mRNA for each sample. (b) The relative protein level of PPARα was normalized to endogenous β-actin protein for each sample. Dates are expressed as mean ± SD of four individual experiments. **P < 0.01 compared with sham group; *P < 0.05 compared with sham group.
Figure 5
Figure 5
Time-dependent expression of PPARβ in global cerebral I/R rat hippocampus (n = 4). (a) The relative mRNA level of PPARβ was normalized to endogenous β-actin mRNA for each sample. (b) The relative protein level of PPARβ was normalized to endogenous β-actin protein for each sample. Dates are expressed as mean ± SD of four individual experiments. **P < 0.01 compared with sham group; *P < 0.05 compared with sham group.
Figure 6
Figure 6
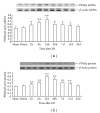
Time-dependent expression of PPARγ in global cerebral I/R rat hippocampus(n = 4). (a) The relative mRNA level of PPARγ was normalized to endogenous β-actin mRNA for each sample. (b) The relative protein level of PPARγ was normalized to endogenous β-actin protein for each sample. Dates are expressed as mean ± SD of four individual experiments. **P < 0.01 compared with sham group; *P < 0.05 compared with sham group.

References

    1. Liang HW, Qiu SF, Shen J, et al. Genistein attenuates oxidative stress and neuronal damage following transient global cerebral ischemia in rat hippocampus. Neuroscience Letters. 2008;438(1):116–120. - PubMed
    1. Bordet R, Gelé P, Duriez P, Fruchart JC. PPARs: a new target for neuroprotection. Journal of Neurology, Neurosurgery and Psychiatry. 2006;77(3):285–286. - PMC - PubMed
    1. Büttnera F, Cordesb C, Gerlachc F, et al. Genomic response of the rat brain to global ischemia and reperfusion. Brain Research. 2009;1252:1–14. - PubMed
    1. Cullingford TE, Bhakoo K, Peuchen S, Dolphin CT, Patel R, Clark JB. Distribution of mRNAs encoding the peroxisome proliferator-activated receptor α, β, and γ and the retinoid X receptor α, β, and γ in rat central nervous system. Journal of Neurochemistry. 1998;70(4):1366–1375. - PubMed
    1. Moreno S, Farioli-vecchioli S, Cerù MP. Immunolocalization of peroxisome proliferator-activated receptors and retinoid X receptors in the adult rat CNS. Neuroscience. 2004;123(1):131–145. - PubMed

LinkOut - more resources