. 2013 Jan 10;10(1):5.
doi: 10.1186/2045-8118-10-5.

Impedance-based cell monitoring: barrier properties and beyond

Affiliations

Impedance-based cell monitoring: barrier properties and beyond

Kathrin Benson et al. Fluids Barriers CNS. .

Abstract

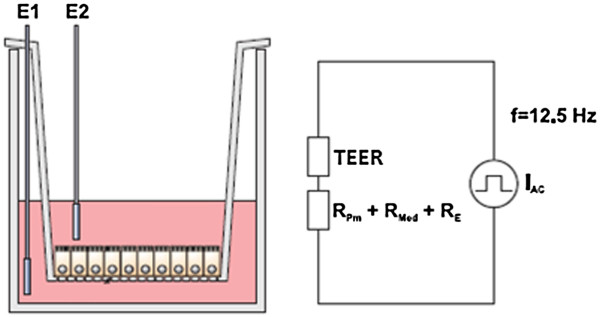
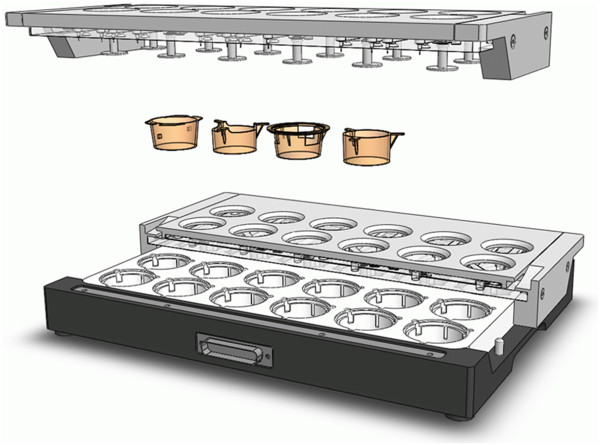
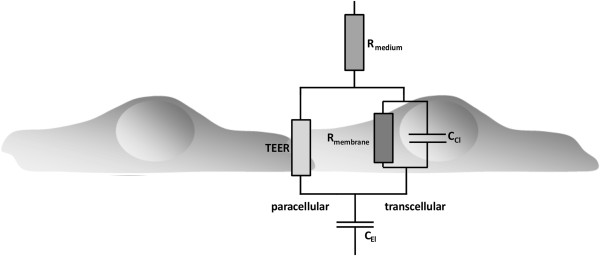
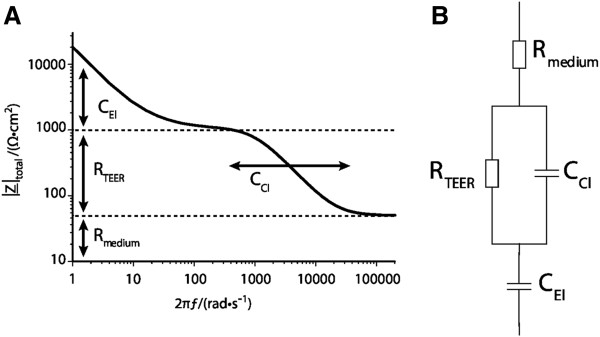
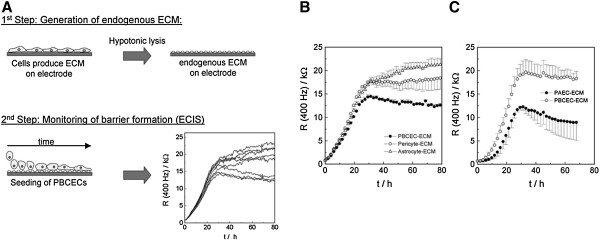
In multicellular organisms epithelial and endothelial cells form selective permeable interfaces between tissue compartments of different chemical compositions. Tight junctions which connect adjacent cells, control the passage of molecules across the barrier and, in addition, facilitate active transport processes. The cellular barriers are not static but can be deliberately modulated by exposure to specific external stimuli. In vitro models representing the essential absorption barriers of the body are nowadays available, thus allowing investigation of the parameters that control permeability as well as transport processes across those barriers. Independent of the origin of the barrier forming cells, techniques are needed to quantify their barrier integrity. One simple assay is to measure the permeability for given hydrophilic substrates possessing different molecular weights like sucrose or dextrans. However, this technique is time-consuming and labor-intensive. Moreover, radioactive or fluorescently-labeled substrates are needed to allow easy analytical detection. Finally, if transport processes are investigated, the standard permeant may interfere with the transport process under investigation or might even alter the barrier integrity by itself. Thus, independent, non-invasive techniques are needed to quantify the barrier integrity continuously during the experiment. Such techniques are available and are mainly based on the measurement of the transendothelial or transepithelial electrical resistance (TEER) of barrier forming cells grown on porous membranes. Simple devices using two sets of electrodes (so-called Voltohmeters) are widely used. In addition, an easy-to-use physical technique called impedance spectroscopy allows the continuous analysis of both the TEER and the electrical capacitance giving additional information about the barrier properties of cells grown on permeable membranes. This technique is useful as a quality control for barrier forming cells. Another impedance-based approach requires cells to be grown directly on solid, micro-structured electrodes. Here, we will discuss the physical background of the different techniques; advantages, disadvantages, and applications will be scrutinized. The aim is to give the reader a comprehensive understanding concerning the range and limits of the application, mainly focusing on endothelial cells.


Figures

Figure 1
Figure 1
Impedance measurements with chopstick-like electrodes. The chopstick-like electrodes (E1,E2) are traditionally used to determine the electric resistance of cells grown on filter inserts. The ohmic resistance of the cell layer (TEER), the cell culture medium in the upper and lower compartment (RMed), the membrane of the filter inserts (Rpm) and electrode-medium interface (RE) all contribute to the total electric resistance. IAC: alternating current. Adapted from [14] with permission.
Figure 2
Figure 2
Setup of the cellZscope device. The cell module can be loaded with a broad range of standard cell culture inserts ranging from 6 to a maximum of 24 inserts. The TEER of all inserts can be measured continuously. During the experiment the cell module can be placed in a standard incubator. From [14] with permission.
Figure 3
Figure 3
Equivalent circuit diagram describing the contribution of the trans- and paracellular pathway to the total impedance, Z, of the cellular system. TEER, transendothelial electric resistance; CEl, capacitance of the electrodes; CCl, capacitance of the cell layer; Rmedium, ohmic resistance of the medium; Rmembrane, ohmic resistance of the membranes. Please note that for most epithelial cells the TEER can be dominated by the transcellular pathway. This is true for tight epithelia already under resting conditions and, in leaky epithelia, after activation of ion channels.
Figure 4
Figure 4
(A) Schematic impedance spectrum of a cell monolayer at different frequencies.(B) Equivalent electrical circuit diagram for a cell monolayer. At mid-range frequencies the cell-related parameters TEER and capacitance Ccl are contributing predominantly to the total impedance. At the lower end of the frequency range the spectrum is dominated by the capacity of the electrodes (CEl). At high frequencies the capacitors Ccl and Cel become increasingly conductive and the remaining total impedance converges to the resistance of the medium (RMedium). Adapted from [15] with permission.
Figure 5
Figure 5
Development over time of the TEER of primary porcine capillary endothelial cells cultured in serum-free medium supplemented with hydrocortisone (orange curve) and without hydrocortisone (blue curve): In the presence of hydrocortisone an increase of the TEER is observed due to improved barrier integrity. Adapted from [18] with permission.
Figure 6
Figure 6
Influence of poly(butyl)cyanoacrylate nanoparticles (PBCA-NP) on the integrity of porcine brain capillary endothelial cells (PBCEC).(A) TEER development over time after the addition of PBCA-NP in different concentrations. (B)14C-Sucrose permeability at different times after the addition of PBCA-NP (13.31 μg/mL). From [20] with permission.
Figure 7
Figure 7
The scanning electron microscope picture (left) shows a neutrophil that is invading the endothelial cell layer from the apical (blood) side. The arrows on the right side show contact areas of the flattened neutrophil with the endothelial cell surface while the arrows on the left side point towards the tight junctions. Note the distance of the neutrophil to the cell junctions indicating transcellular migration. When monitored by TEER measurement (right) after inflammatory stimulation of the cells with TNF-α, neutrophil application did not result in a change in electrical resistance. Adapted from [22] with permission.
Figure 8
Figure 8
Schematic drawing of an ECIS array and principle of the electric cell-substrate impedance sensing (ECIS) method. Cell layers are grown to confluence on integrated gold-film electrodes. An applied AC current flows between small working electrodes and the larger counter electrode using normal culture medium as an electrolyte. By a variation of the frequency ω, a spectrum can be obtained. Applying higher frequencies the current flow is dominated by the capacity of the total system, at mid-range frequencies the ohmic resistance of the total system is mirrored. Adapted from Applied BioPhysics, Inc [28].
Figure 9
Figure 9
The current pathway at low frequencies on a cerebral endothelial cell monolayer (ECIS method, 400 Hz). At low frequencies the current predominantly flows paracellular (through extracellular matrix proteins) and between adjacent cells (through tight junctions) and the electrolyte (medium), see bold arrows. Adapted from Applied BioPhysics, Inc [28].
Figure 10
Figure 10
By application of high frequencies (ECIS method, > 40 kHz), the capacitive amount of measured impedance is especially sensitive for adhered cells. The current passes through the insulating cell monolayer, especially through cell membranes. Adapted from Applied BioPhysics, Inc [28].
Figure 11
Figure 11
Determination of the adhesion process and progression of the resistance of cells on ECIS arrays with time.(A) The adhesion process can be determined by application of the frequency (f > 40 kHz). (B) By application of a frequency (f < 400 Hz) the development of cell-cell contacts (tight junctions) can be monitored. Bold arrow indicates the small fluctuations on the electrode due to micro motion in the cell monolayers. From [31] with permission.
Figure 12
Figure 12
Overview of the Giaever and Keese model [32]of the determination of specific parameters of cell-cell- and cell-substrate contact. Cells are modeled as circular disks hovering at a distance h above the electrode surface. The solid lines indicate paracellular current flow, the broken line represents transcellular current flow. Rb represents resistance of the cell-cell contact; Cm explains the capacity of the cell layers and the α term describes the impedance contributions arising from the proximity of the cell monolayer to the surface of the electrodes (cell-substrate contacts). |Ζmodel| describes the total impedance at different frequencies ω, the resistance of the cell-cell contact Rb, capacitance Cm of the cell layers and the α term. For more details on the equation see reference [32]. From [31] with permission.
Figure 13
Figure 13
Schematic illustration of the experimental setup to determine the impact of different endogenous extracellular matrices (ECM) on the integrity of brain capillary endothelial cells (PBCEC) using ECIS technique.(A) Establishment of endogenous extracellular matrices derived from astrocytes, pericytes, aorta (PAEC) and cerebral endothelial cells (PBCEC) on the ECIS electrode surfaces (1st step). Seeding of PBCEC on ECIS electrodes that had been pre-coated with endogenous extracellular matrices. Monitoring the progression of the barrier formation of PBCEC on different matrices (2nd step) by ECIS technique. (B,C) Analysis of the impact of extracellular matrices on the barrier integrity on PBCECs. Time course of the resistance measured at a sampling frequency of 400 Hz. (B) Comparison between astrocyte, pericyte and PCBEC derived endogenous extracellular (as control) matrix on the integrity of PBCEC. (C) Represents the relation between aorta derived matrices to endothelial derived matrices (control). Each data point represents the mean ± SD From [33] with permission.
Figure 14
Figure 14
(A) Time course of normalized capacitance C of a sampling frequency of 40 kHz wounding of normal rat kidney (NRK) epithelial cells (wounding parameters: 4 V, 20 s, 40 kHz). The arrow indicates the time point of injury (2). (B) Confocal laser scanning microscopy (CLSM) images of the Live/Dead Assay show vital cells surrounding the active electrode surface (calcein acetoxymethylester stained in green) and dead cells (ethidium homodimer-1 stained in red) on the electrode itself. (B; 1-4) Documentation of the wound healing process by CLSM images, 1 = before wounding, 2 = after wounding, 3 = after partial wound healing, 4 = after complete wound healing. From [34] with permission.

References

    1. Abbott NJ, Ronnback L, Hansson E. Astrocyte-endothelial interactions at the blood–brain barrier. Nat Rev Neurosci. 2006;7:41–53. doi: 10.1038/nrn1824. - DOI - PubMed
    1. Cho C-W, Liu Y, Cobb W, Henthorn T, Lillehei K, Christians U, Ng K-Y. Ultrasound-induced mild hyperthermia as a novel approach to increase drug uptake in brain microvessel endothelial cells. Pharm Res. 2002;19:1123–1129. doi: 10.1023/A:1019837923906. - DOI - PubMed
    1. Rapoport SI. Osmotic opening of the blood–brain barrier: principles, mechanism, and therapeutic applications. Cell Mol Neurobiol. 2000;20:217–230. doi: 10.1023/A:1007049806660. - DOI - PMC - PubMed
    1. Schirmacher A, Winters S, Fischer S, Goeke J, Galla HJ, Kullnick U, Ringelstein EB, Stogbauer F. Electromagnetic fields (1.8 GHz) increase the permeability to sucrose of the blood–brain barrier in vitro. Bioelectromagnetics. 2000;21:338–345. doi: 10.1002/1521-186X(200007)21:5<338::AID-BEM2>3.0.CO;2-Q. - DOI - PubMed
    1. Deli MA, Abraham CS, Kataoka Y, Niwa M. Permeability studies on in vitro blood–brain barrier models: physiology, pathology, and pharmacology. Cell Mol Neurobiol. 2005;25:59–127. doi: 10.1007/s10571-004-1377-8. - DOI - PMC - PubMed