Clinical Trial
. 2013 May;62(5):1453-63.
doi: 10.2337/db12-1116. Epub 2013 Jan 10.

Fibroblast growth factor 21 mediates specific glucagon actions

Affiliations
Clinical Trial

Fibroblast growth factor 21 mediates specific glucagon actions

Kirk M Habegger et al. Diabetes. 2013 May.

Abstract

Glucagon, an essential regulator of glucose homeostasis, also modulates lipid metabolism and promotes weight loss, as reflected by the wasting observed in glucagonoma patients. Recently, coagonist peptides that include glucagon agonism have emerged as promising therapeutic candidates for the treatment of obesity and diabetes. We developed a novel stable and soluble glucagon receptor (GcgR) agonist, which allowed for in vivo dissection of glucagon action. As expected, chronic GcgR agonism in mice resulted in hyperglycemia and lower body fat and plasma cholesterol. Notably, GcgR activation also raised hepatic expression and circulating levels of fibroblast growth factor 21 (FGF21). This effect was retained in isolated primary hepatocytes from wild-type (WT) mice, but not GcgR knockout mice. We confirmed this link in healthy human volunteers, where injection of natural glucagon increased plasma FGF21 within hours. Functional relevance was evidenced in mice with genetic deletion of FGF21, where GcgR activation failed to induce the body weight loss and lipid metabolism changes observed in WT mice. Taken together, these data reveal for the first time that glucagon controls glucose, energy, and lipid metabolism at least in part via FGF21-dependent pathways.


Figures
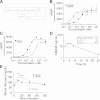
FIG. 1.
FIG. 1.
Characteristics of the GcgR agonist IUB288. A: IUB288 chemical structure. Activity of IUB288 at the GcgR (B) and GLP-1 receptor (C) in cultured HEK293 cells. Dose-normalized bioavailability of IUB288 (D) after a single subcutaneous injection (10 nmol/kg) in C57Bl/6J mice (displayed as the mean of n = 2). Blood glucose excursion (E) in response to an acute IUB288 challenge (10 nmol/kg) in lean, chow-fed, male C57Bl/6J mice (n = 8 per treatment). All data are represented as mean ± SEM. ***P < 0.001 vs. vehicle control, two-way ANOVA with Bonferroni post hoc analysis.
FIG. 2.
FIG. 2.
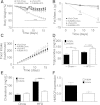
Dose-dependency study of chronic GcgR activation. Body weight (A), food intake (B), and ad libitum blood glucose (C and D) in response to vehicle (PBS, ○) or 0.3 (●), 1.0 (□), 3.0 (■), or 10 nmol/kg/day (△) IUB288. All treatments were conducted in 11-month-old male C57Bl/6J mice maintained on HFD for 9 months. All data are represented as mean ± SEM; n = 8 per treatment. **P < 0.01; ***P < 0.001 vs. vehicle control, two-way ANOVA with Bonferroni post hoc analysis. Lowercase letters (D) denote statistically similar (P > 0.05) groups, one-way ANOVA with Bonferroni post hoc analysis.
FIG. 3.
FIG. 3.
Effects of chronic GcgR activation on energy balance and plasma lipids. Body weight (A), fat mass (B), and food intake (C) in response to 16 days of vehicle (PBS, closed symbols) or 10 nmol/kg/day IUB288 (open symbols) treatment in standard chow– (circles) or HFD-fed (squares) C57Bl/6J mice. Plasma concentrations of triglycerides (D) and cholesterol (E) and hepatic HMGCR expression (F) after 18 days of vehicle (PBS, closed bars) or 10 nmol/kg/day IUB288 (open bars) in standard chow– or HFD-fed C57Bl/6J mice. All treatments were conducted in 11-month-old male C57Bl/6J mice maintained on standard chow or HFD for 9 months. All data are represented as mean ± SEM; n = 8 per treatment. AC: *P < 0.05; ***P < 0.001 vs. vehicle control, two-way ANOVA with Bonferroni post hoc analysis. D and E: ***P < 0.001 vs. vehicle control, one-way ANOVA with Bonferroni post hoc analysis. F: *P < 0.05 vs. vehicle control, unpaired Student t test.
FIG. 4.
FIG. 4.
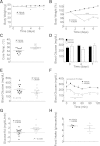
Effects of chronic GcgR activation in db/db mice. Absolute (A) and relative body weight (B) of db/db mice during 7 days of vehicle (PBS, ■) or 10 nmol/kg/day IUB288 (□) treatment. Body core temperature (C) on day 6 of vehicle (PBS, ■) or 10 nmol/kg/day IUB288 (□). Ad libitum blood glucose during chronic GcgR activation (D). Fasting blood glucose (6 h) (E) of db/db mice after 7 days of chronic GcgR activation. Blood glucose excursion (F) and rate of disappearance (Kd, 0–45 min) during 0.75 units/kg insulin challenge (G) after 7 days of chronic GcgR activation in 6-h fasted db/db mice. Cumulative food intake (H) of db/db mice (three cages of four mice per cage) during 7 days of vehicle (PBS, ■) or 10 nmol/kg/day IUB288 (open squares) treatment. All treatments were conducted in 12-week-old male db/db mice maintained on standard chow diet. All data are represented as mean ± SEM; n = 11–12 per treatment. A, B, and F: *P < 0.05; ***P < 0.001 vs. vehicle control, two-way ANOVA with Bonferroni post hoc analysis. C: **P < 0.01 vs. vehicle control, unpaired Student t test.
FIG. 5.
FIG. 5.
Glucagon as an FGF21 secretagogue. Plasma FGF21 concentration (A) in response to acute GcgR activation (n = 8; 10 nmol/kg IUB288). Hepatic FGF21 expression (B) and plasma FGF21 concentration (C) after 18 days of vehicle (PBS, closed bars) or 10 nmol/kg/day IUB288 (open bars) in 2-h fasted, HFD-fed mice (n = 4–5). Relative FGF21 expression (D) and secretion (E) in isolated primary hepatocytes from WT and GcgR knockout (GcgR−/−) mice after 9.5 and 25 h glucagon treatment, respectively. Relative FGF21 expression in cultured H4IIE cells (F) after 120 min GcgR activation (0.133 nmol/mL IUB288). Plasma FGF21 concentration (G) and area under the curve (AUC) analysis (H) after glucagon challenge (1 mg) in human subjects. Data from AC obtained in 11-month-old male C57Bl/6J mice maintained on HFD for 9 months. All data are represented as mean ± SEM. A and G: *P < 0.05; **P < 0.01; ***P < 0.001 vs. vehicle control, two-way ANOVA with Bonferroni post hoc analysis. B, C, F, and H: *P < 0.05; ***P < 0.001 vs. vehicle control, unpaired Student t test. D and E: Sigmoidal dose-response best fit (with variable slope).
FIG. 6.
FIG. 6.
Energy balance during chronic GcgR activation in FGF21−/− mice. Body weight, fat mass, lean mass, and food intake of WT (A, C, E, and G) and FGF21−/− (B, D, F, and H) mice during 20 days of vehicle (PBS, closed symbols) or 10 nmol/kg/day IUB288 (open symbols) treatment. All treatments were conducted in 12-week-old male littermates maintained on standard chow diet until day 0 and then switched to HFD upon initiation of GcgR activation. All data are represented as mean ± SEM; n = 12–16. *P < 0.05; **P < 0.01; ***P < 0.001 vs. genotype-specific vehicle control, two-way ANOVA with Bonferroni post hoc analysis.
FIG. 7.
FIG. 7.
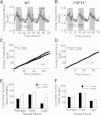
EE during chronic GcgR activation. Dynamic and cumulative EE and locomotor activity of WT (A, C, and E) and FGF21−/− (B, D, and F) mice during 72 h of vehicle (PBS, closed symbols) or 10 nmol/kg/day IUB288 (open symbols) treatment. All treatments were conducted in 12-week-old male littermates maintained on standard chow diet. IUB288 or vehicle administered daily, 2 h prior to dark phase. P values of AC denote main effect of treatment vs. vehicle control by two-way ANOVA. All data are represented as mean ± SEM; n = 6. E: **P < 0.01 vs. genotype-specific vehicle control, two-way ANOVA with Bonferroni post hoc analysis.
FIG. 8.
FIG. 8.
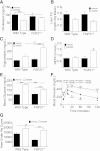
Lipidemia and glycemia during chronic GcgR activation. Liver triglyceride (B) and plasma cholesterol (A), triglyceride (C), and NEFA (D) concentrations of WT and FGF21−/− mice after 20 days of vehicle (PBS, closed symbols) or 10 nmol/kg/day IUB288 (open symbols) treatment (n = 4–6). Ad libitum blood glucose (E) of WT and FGF21−/− mice on day 19. Glucose tolerance (F) (as assessed by 1.5 g/kg intraperitoneal glucose challenge) and area under the curve analysis (G) of WT (squares) and FGF21−/− (circles) mice after 19 days of vehicle (PBS, closed symbols) or 10 nmol/kg/day IUB288 (open symbols) treatment (n = 12–16). All treatments conducted in 12-week-old male littermates maintained on standard chow diet until day 0 and then switched to HFD upon initiation of GcgR activation. All data are represented as mean ± SEM. *P < 0.05; **P < 0.01; ***P < 0.001 vs. genotype-specific vehicle control, two-way ANOVA with Bonferroni post hoc analysis. F: **P < 0.01; ***P < 0.001 vs. WT vehicle control, two-way ANOVA with Bonferroni post hoc analysis.

Comment in

References

    1. Quesada I, Todorova MG, Soria B. Different metabolic responses in alpha-, beta-, and delta-cells of the islet of Langerhans monitored by redox confocal microscopy. Biophys J 2006;90:2641–2650 - PMC - PubMed
    1. Gu W, Yan H, Winters KA, et al. Long-term inhibition of the glucagon receptor with a monoclonal antibody in mice causes sustained improvement in glycemic control, with reversible alpha-cell hyperplasia and hyperglucagonemia. J Pharmacol Exp Ther 2009;331:871–881 - PubMed
    1. Wang MY, Chen L, Clark GO, et al. Leptin therapy in insulin-deficient type I diabetes. Proc Natl Acad Sci USA 2010;107:4813–4819 - PMC - PubMed
    1. Brown RJ, Sinaii N, Rother KI. Too much glucagon, too little insulin: time course of pancreatic islet dysfunction in new-onset type 1 diabetes. Diabetes Care 2008;31:1403–1404 - PMC - PubMed
    1. Dunning BE, Gerich JE. The role of alpha-cell dysregulation in fasting and postprandial hyperglycemia in type 2 diabetes and therapeutic implications. Endocr Rev 2007;28:253–283 - PubMed

Publication types

MeSH terms