. 2013 May;62(5):1569-80.
doi: 10.2337/db12-0849. Epub 2013 Jan 10.

Thyroid hormone promotes postnatal rat pancreatic β-cell development and glucose-responsive insulin secretion through MAFA

Affiliations

Thyroid hormone promotes postnatal rat pancreatic β-cell development and glucose-responsive insulin secretion through MAFA

Cristina Aguayo-Mazzucato et al. Diabetes. 2013 May.

Abstract

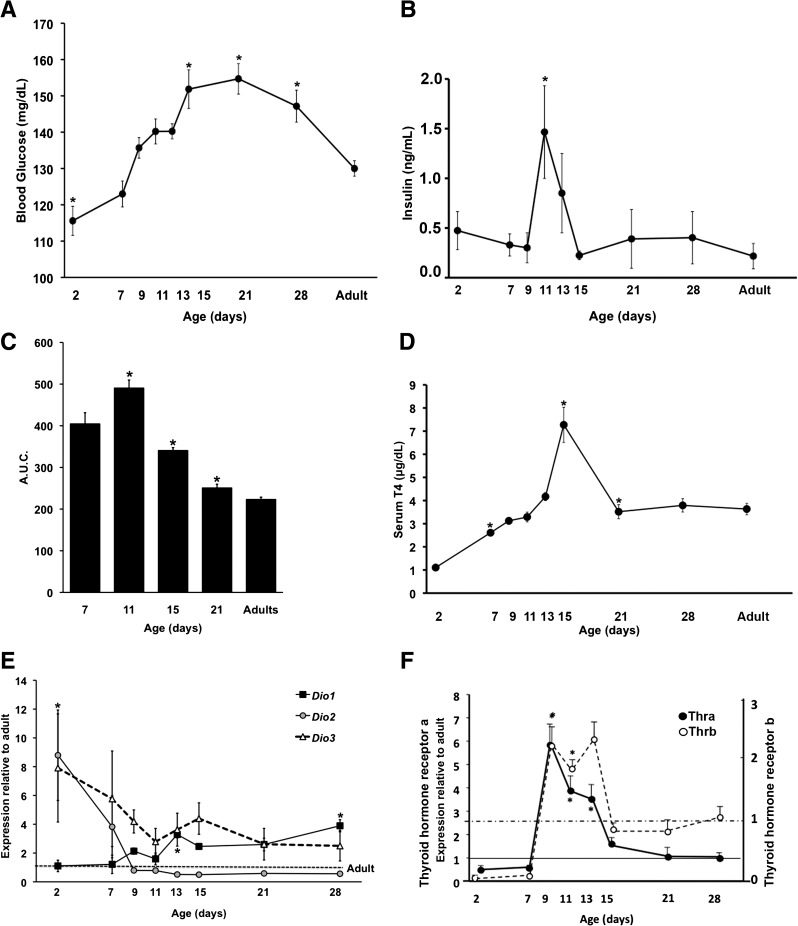
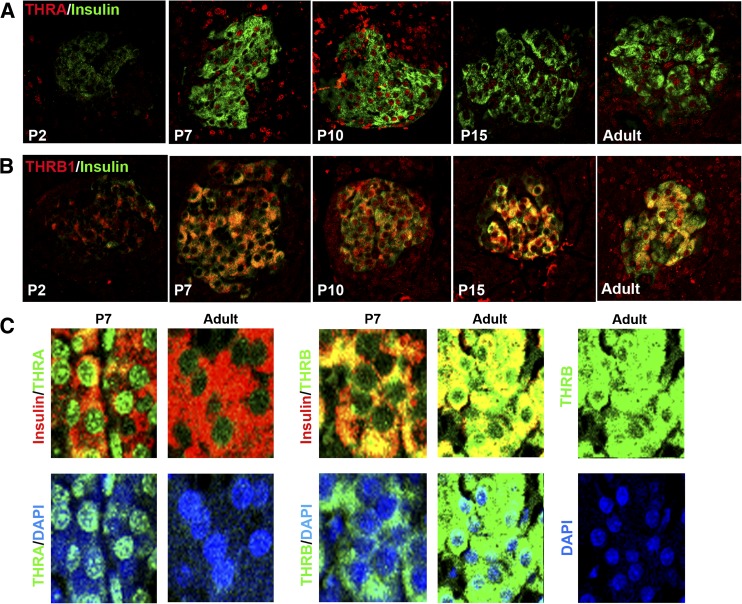
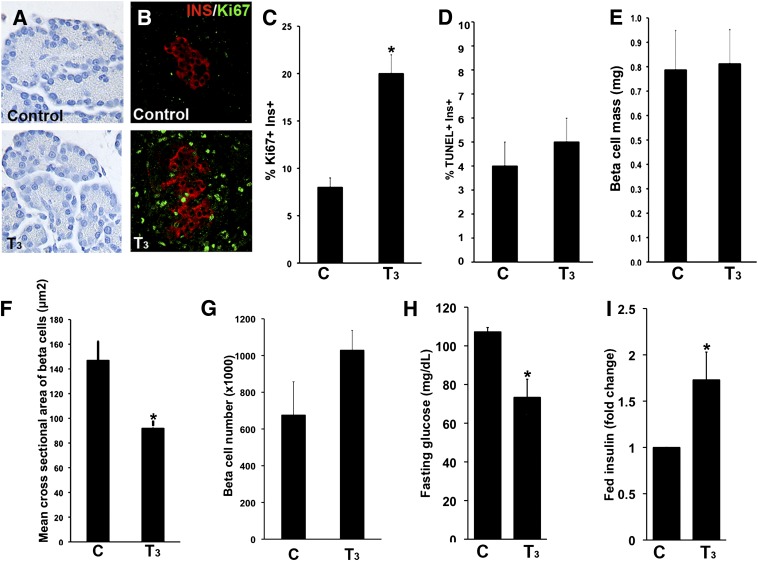
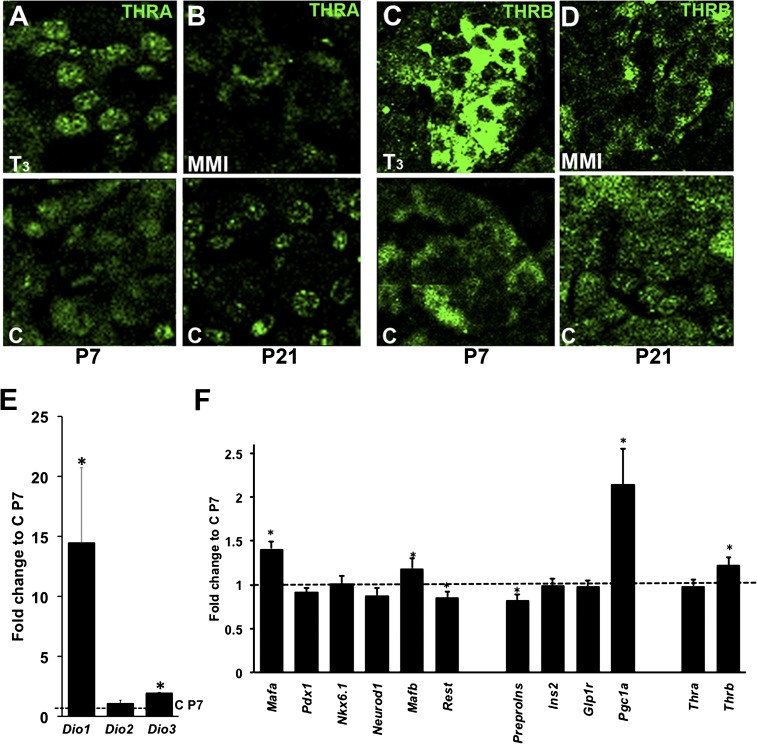
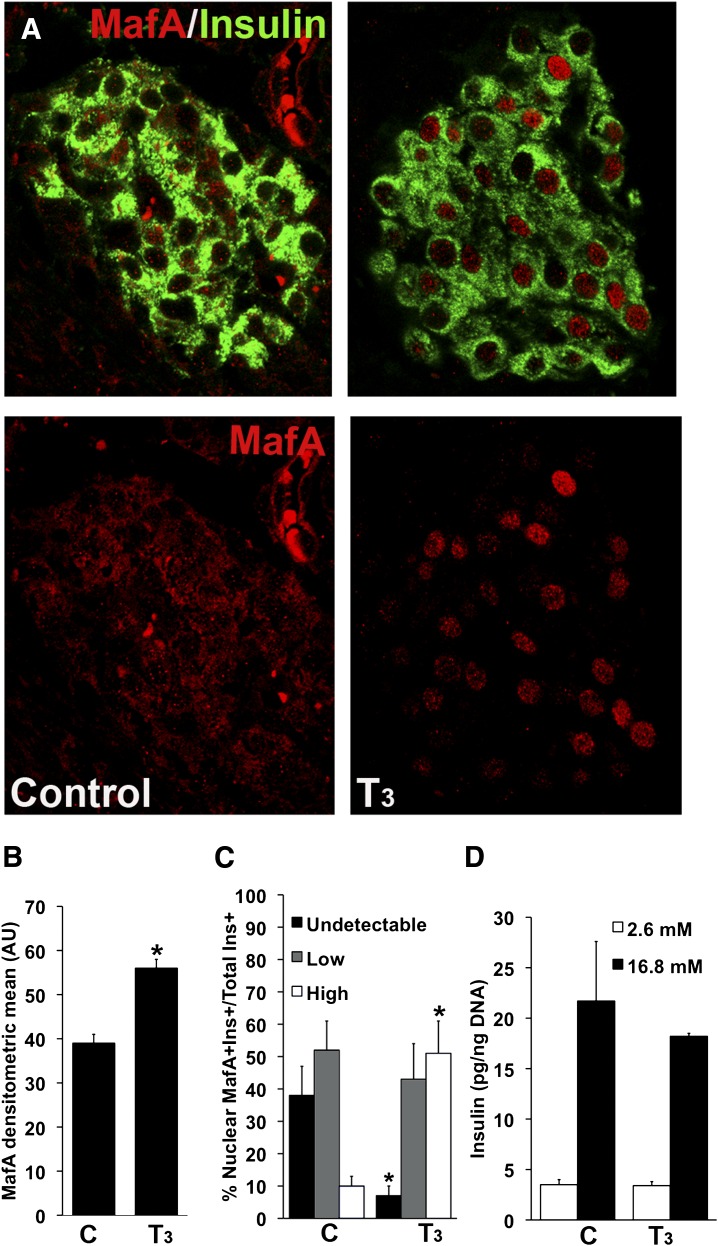
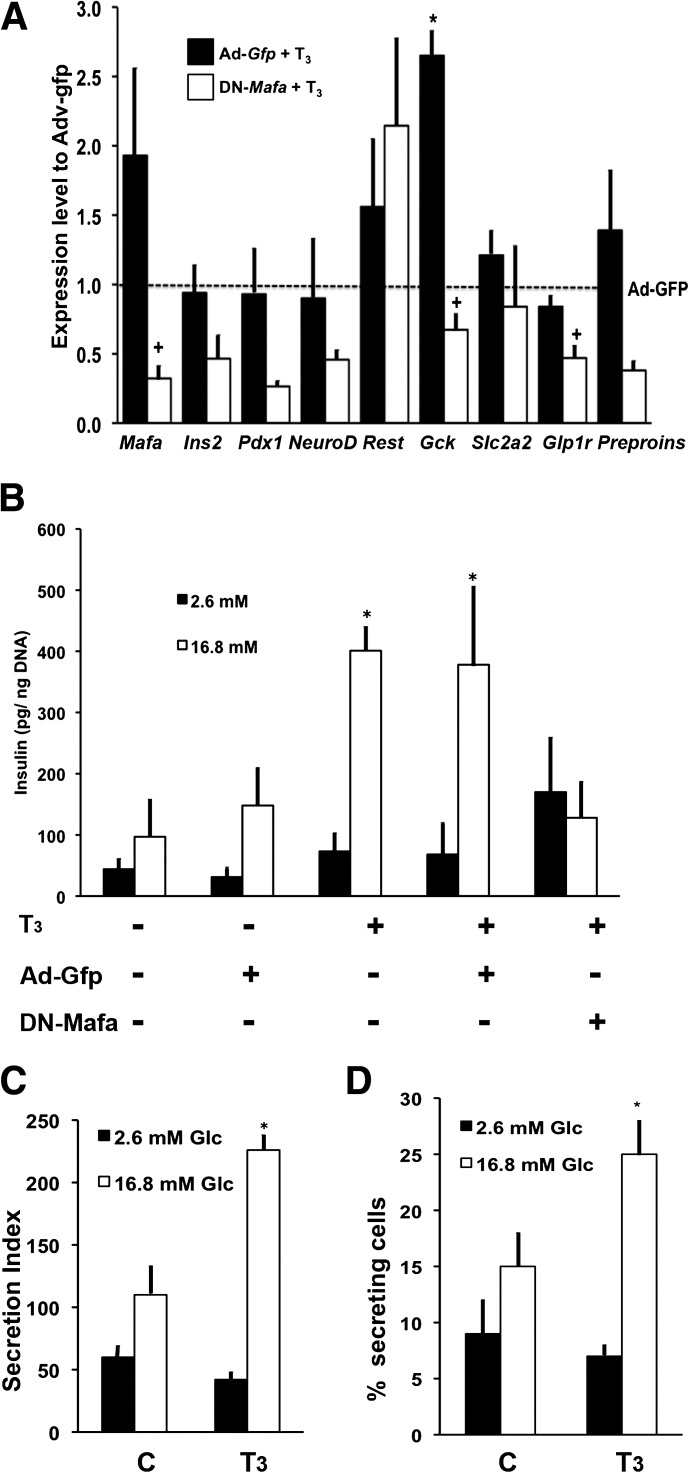
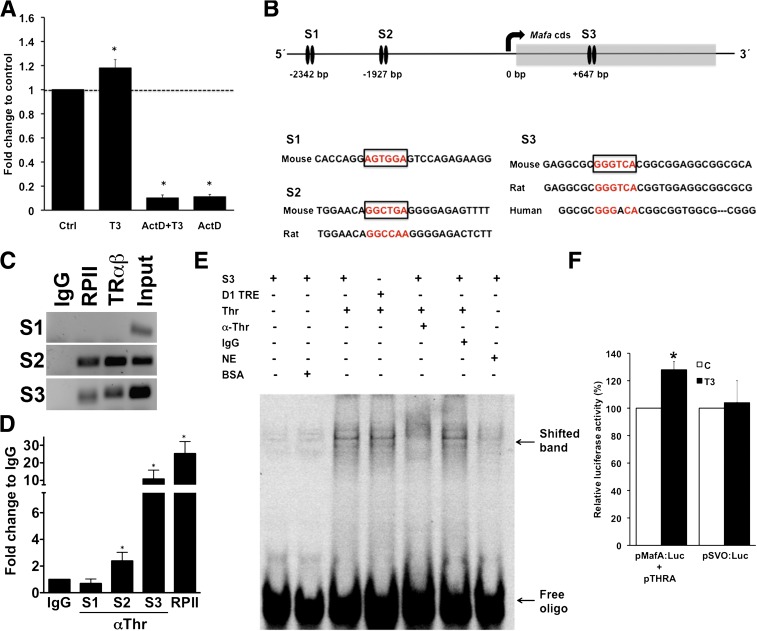
Neonatal β cells do not secrete glucose-responsive insulin and are considered immature. We previously showed the transcription factor MAFA is key for the functional maturation of β cells, but the physiological regulators of this process are unknown. Here we show that postnatal rat β cells express thyroid hormone (TH) receptor isoforms and deiodinases in an age-dependent pattern as glucose responsiveness develops. In vivo neonatal triiodothyronine supplementation and TH inhibition, respectively, accelerated and delayed metabolic development. In vitro exposure of immature islets to triiodothyronine enhanced the expression of Mafa, the secretion of glucose-responsive insulin, and the proportion of responsive cells, all of which are effects that were abolished in the presence of dominant-negative Mafa. Using chromatin immunoprecipitation and electrophoretic mobility shift assay, we show that TH has a direct receptor-ligand interaction with the Mafa promoter and, using a luciferase reporter, that this interaction was functional. Thus, TH can be considered a physiological regulator of functional maturation of β cells via its induction of Mafa.


Figures

FIG. 1.
FIG. 1.
Metabolism and thyroid status change over the first postnatal month. Values shown as means ± SEM. A: Fed blood glucose (n = 5–27 animals per age; *P < 0.0001); B: plasma insulin (n = 4 animals per age; *P < 0.04). AUC for intraperitoneal glucose tolerance test (C) and serum T4 (D) seen at different ages; n = 5–27 animals per age, *P < 0.0001 with respect to the previous age in C and D. Deiodinase (Dio1, type 1; Dio2, type 2; Dio3, type 3) (E) and thyroid receptor isoform mRNA (F) over the same time course by quantitative PCR; the same samples are used for both. Data are expressed as -fold change with respect to adult levels (10 weeks old) using S25 as the internal control gene (n = 4–6 samples per age, each pooled from 3–10 animals; *P ≤ 0.0001).
FIG. 2.
FIG. 2.
Changing pattern of THR isoform proteins over the neonatal period shown by immunostaining. THRA protein (A, red) and THRB1 protein (B, red) in insulin-expressing (green) β cells change in intensity and location from postnatal day (P) 2 to adult. C: (top) Nuclear localization of THRA or THRB (green) in insulin-positive cells (red) shown at a higher magnification and costained with nuclear stain DAPI (blue); C: (bottom) red channel deleted for visualization of THR. Representative confocal images taken in parallel at the same settings for each protein so the differences in intensity reflect the differences in protein. n = at least three animals per group.
FIG. 3.
FIG. 3.
In vivo T3 treatment from birth until postnatal day (P) 7 affects pancreatic structure, β-cell dynamics, and glucose homeostasis. Representative pictures of acinar cell density (A, hematoxylin stained) and replicating β cells (B, insulin [red] and Ki-67 [green]) in pancreatic sections from T3-treated and control rats at P7. β-Cell proliferation (Ki-67+; n = 160–327 islets) (C); apoptosis (TUNEL staining; n = 160–178 islets) (D); β-cell mass (n = 6–7 animals) (E); mean cross-sectional area (cell size; n = 7,000–8,794 cells per condition) (F); calculated number of β cells per pancreas (n = 3–4 animals) (G); fasting blood glucose (n = 8–9 animals) (H); and fed plasma insulin (n = 21–22 animals; controls: 0.4 ± 0.03 vs. T3 treated: 0.5 ± 0.04 ng/mL) (I) levels for T3-treated and control animals at P7. Values shown as mean ± SEM; *P < 0.01 with respect to untreated animals.
FIG. 4.
FIG. 4.
T3 treatment results in differential changes of thyroid receptor proteins and islet gene expression. Islets from T3-treated and untreated animals at postnatal day (P) 7 immunostained for THRA (A) and THRB (C) or from MMI-treated rats at P21 stained for THRA (B) and THRB (D). Representative confocal images were taken at the same settings for each protein so differences in intensity reflect differences in protein. At least three animals each group. Changes in Dio1, Dio2, and Dio3 (n = 3) (E) and key islet gene (n = 18) (F) mRNA in islets isolated from T3-treated and untreated control pups by quantitative PCR at P7. Values shown as mean ± SEM; *P < 0.05 with respect to control animals at P7.
FIG. 5.
FIG. 5.
In vivo T3 treatment increased Mafa expression and enhanced its nuclear localization but did not increase glucose-stimulated insulin secretion. A: Representative images from T3-treated and control animals at postnatal day (P) 7 immunostained for insulin (green) and MAFA (red); bottom panels show only the red channel for MAFA visualization. B: Intensity was quantified as densitometric mean of MAFA staining from at least three animals per group. C: Nuclear localization of MAFA in islets of animals treated with T3 increased compared with untreated controls at P7. Quantification of 600–2,200 insulin+ cells from four or five animals for each group. D: Glucose-stimulated insulin secretion in static incubations of islets freshly isolated from in vivo T3-treated animals at P7 or control animals (n = 5–6 experiments). Values shown as mean ± SEM; *P < 0.02 with respect to controls.
FIG. 6.
FIG. 6.
In vitro T3 selectively increased Mafa mRNA and enhanced glucose-stimulated insulin secretion. A: Culture for 4 days with T3 (7.5 pmol/L free T3) induced changes in key islet mRNA levels in islets isolated from animals at postnatal day (P) 7 and infected with either control Ad-Gfp (black bars) or DN Mafa (white bars) as normalized to those of Ad-Gfp without T3 treatment. (*P < 0.04 respect to Ad-Gfp; +P < 0.05 respect to Ad-Gfp+T3; n = 4–7). B: Insulin secretion from similarly infected and cultured islets at P7 in response to 2.6 mmol/L glucose (black bars) and 16.8 mmol/L glucose (white bars) in sequential static incubations (seven experiments for Ad-Gfp +T3 and four for Ad-Gfp +T3 +DN-Mafa; *P < 0.04 with respect to Ad-Gfp). C: T3-enhanced glucose-responsive insulin secretion was confirmed by reverse hemolytic plaque assay for individual cell secretion, showing an increased percentage of insulin-secreting cells (D) (three experiments; *P ≤ 0.006 with respect to 2.6 mmol/L glucose). Values shown as mean ± SEM.
FIG. 7.
FIG. 7.
T3 directly enhanced Mafa transcription. A: Increase of Mafa mRNA induced in INS-1 cells by T3 was ablated by incubation with actinomycin D (ActD). Culture with T3 in 1.6 mmol/L glucose for 6 h (values shown as mean ± SEM; *P < 0.03; n = 3–6 independent experiments). B: Schema of the murine Mafa promoter and coding sequence. The top arrow indicates the transcription start site. The black ovals indicate the experimentally tested TRE sites by ChIP: site 1 (S1), site 2 (S2), and site 3 (S3). The TREs are localized at −2,342/–2,354, −1,927/–1,946 and +647/+659. The amplified sequences are shown as is their conservation in other species. S1 is not conserved in humans or rats, whereas S2 is conserved in rats but not in humans. C: In ChIP studies of MIN-6 cells using an antibody against THR, putative TREs from S2 and S3 showed direct binding of the THR, but no binding was evident at S1. Gel representative of three or four experiments. D: Quantitative PCR products from ChIP-amplified DNA with corresponding IgG, RPII, and input. (values shown as mean ± SEM; *P < 0.03; n = 3–4 controls). E: Electrophoretic mobility shift assay showing a band observed in the presence of HEK1 nuclear extract from cells transfected with Thr expression plasmid that was inhibited upon incubation with antibody against. S3, potential TRE Site 3 in Mafa cds; NE, nontransfected nuclear extract; D1 TRE, known TRE in Dio1 promoter; IgG, unspecific antibody; α-THR, antibody against Thr. F: A dual luciferase reporter assay using a firefly luciferase reporter construct with the 5′ Mafa promoter region in MIN-6 cells grown in high-glucose DMEM +/− 100 nmol/L T3 for 24h. Renilla luciferase in a SacI backbone was used as a transfection control (values shown as mean ± SEM; *P < 0.01; n = 3). (A high-quality color representation of this figure is available in the online issue.)

References

    1. Kroon E, Martinson LA, Kadoya K, et al. Pancreatic endoderm derived from human embryonic stem cells generates glucose-responsive insulin-secreting cells in vivo. Nat Biotechnol 2008;26:443–452 - PubMed
    1. D’Amour KA, Bang AG, Eliazer S, et al. Production of pancreatic hormone-expressing endocrine cells from human embryonic stem cells. Nat Biotechnol 2006;24:1392–1401 - PubMed
    1. Jiang J, Au M, Lu K, et al. Generation of insulin-producing islet-like clusters from human embryonic stem cells. Stem Cells 2007;25:1940–1953 - PubMed
    1. Baetge EE. Production of beta-cells from human embryonic stem cells. Diabetes Obes Metab 2008;10(Suppl 4):186–194 - PubMed
    1. Bliss CR, Sharp GW. Glucose-induced insulin release in islets of young rats: time-dependent potentiation and effects of 2-bromostearate. Am J Physiol 1992;263:E890–E896 - PubMed

Publication types

MeSH terms