. 2013 Mar 7;121(10):1819-23.
doi: 10.1182/blood-2012-08-451690. Epub 2013 Jan 10.

Prognostic implications of serial 18-fluoro-deoxyglucose emission tomography in multiple myeloma treated with total therapy 3

Affiliations

Prognostic implications of serial 18-fluoro-deoxyglucose emission tomography in multiple myeloma treated with total therapy 3

Saad Z Usmani et al. Blood. .

Abstract

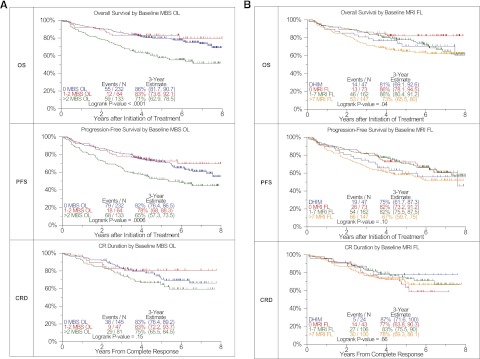
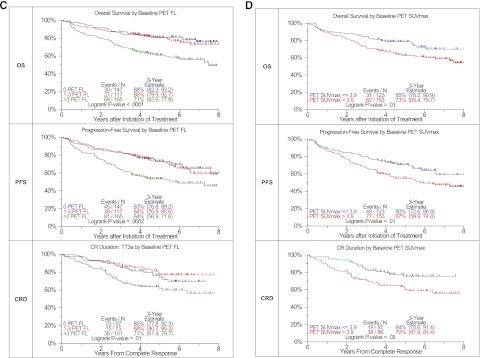
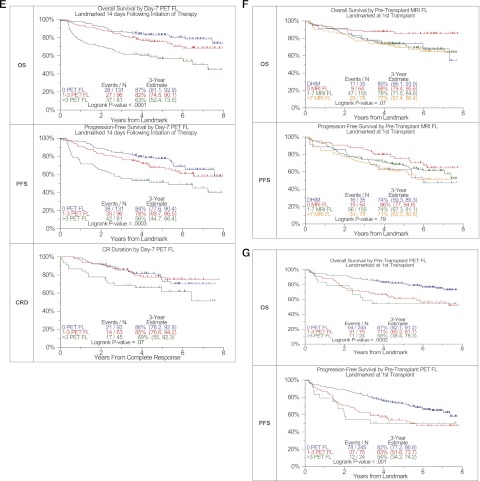
Prognostic implications of 3 imaging tools, metastatic bone survey, magnetic resonance imaging, and positron emission tomography (PET), were evaluated in 2 consecutive Total Therapy 3 trials for newly diagnosed myeloma. Data including PET at baseline and on day 7 of induction as well as standard prognostic factors were available in 302 patients of whom 277 also had gene expression profiling (GEP)-derived risk information. According to multivariate analysis, more than 3 focal lesions on day 7 imparted inferior overall survival and progression-free survival, overall and in the subset with GEP-risk data. GEP high-risk designation retained independent significance for all 3 end points examined. Thus, the presence of > 3 focal lesions on day 7 PET follow-up may be exploited toward early therapy change, especially for the 15% of patients with GEP-defined high-risk disease with a median overall survival expectation of 2 years. This trial was registered at www.clinicaltrials.gov as #NCT00081939 and # NCT00572169.


Figures

Figure 1
Figure 1
Effects of imaging variables on OS, PFS, and CRD in Total Therapy 3A and Total Therapy 3B combined. (A) Baseline number of MBS-defined osteolytic lesions (OL). Superior OS and PFS were linked to the presence of no more than 2 OL. A trend was noted in case of complete response duration. (B) Baseline number of MRI-defined FL and diffuse hyperintense marrow. Trends were observed for superior OS and PFS in case of MRI-FL not exceeding 7 FL. (C) Baseline PET-defined number of FL.The presence of more than 3 PET-defined FL affected all 3 survival end points adversely. (D) Baseline PET-defined SUVmax. Higher SUVmax of PET-defined FL conferred inferior OS, PFS, and complete response (CR) duration. (E) Day 7 PET-FL. OS and PFS were inferior when more than 3 FL persisted on day 7 after starting protocol therapy. In case of CR duration, a strong trend in the same direction was noted. (F) Pretransplant MRI-FL. Trends were observed for both OS and PFS with the best survival at 3 years observed in those with 0 MRI FL, followed by 1 to 7 MRI FL and >7 MRI FL. Similar to the baseline results, survival at 3 years for those with DHIM was more like patients with 1 to 7 or >7 MRI FL. (G) Pretransplant PET-FL. A graded negative impact was observed with increasing PET-defined FL remaining before first transplant.
Figure 1
Figure 1
Effects of imaging variables on OS, PFS, and CRD in Total Therapy 3A and Total Therapy 3B combined. (A) Baseline number of MBS-defined osteolytic lesions (OL). Superior OS and PFS were linked to the presence of no more than 2 OL. A trend was noted in case of complete response duration. (B) Baseline number of MRI-defined FL and diffuse hyperintense marrow. Trends were observed for superior OS and PFS in case of MRI-FL not exceeding 7 FL. (C) Baseline PET-defined number of FL.The presence of more than 3 PET-defined FL affected all 3 survival end points adversely. (D) Baseline PET-defined SUVmax. Higher SUVmax of PET-defined FL conferred inferior OS, PFS, and complete response (CR) duration. (E) Day 7 PET-FL. OS and PFS were inferior when more than 3 FL persisted on day 7 after starting protocol therapy. In case of CR duration, a strong trend in the same direction was noted. (F) Pretransplant MRI-FL. Trends were observed for both OS and PFS with the best survival at 3 years observed in those with 0 MRI FL, followed by 1 to 7 MRI FL and >7 MRI FL. Similar to the baseline results, survival at 3 years for those with DHIM was more like patients with 1 to 7 or >7 MRI FL. (G) Pretransplant PET-FL. A graded negative impact was observed with increasing PET-defined FL remaining before first transplant.

References

    1. Walker RC, Brown TL, Jones-Jackson LB, et al. Imaging of multiple myeloma and related plasma cell dyscrasias. J Nucl Med. 2012;53(7):1091–1101. - PubMed
    1. Waheed S, Mitchell A, Usmani S, et al. Standard and novel imaging methods for multiple myeloma: correlates with prognostic laboratory variables including gene expression profiling data. Haematologica. 2013;98(1):71–78. - PMC - PubMed
    1. Zamagni E, Patriarca F, Nanni C, et al. Prognostic relevance of 18-F FDG PET/CT in newly diagnosed multiple myeloma patients treated with up-front autologous transplantation. Blood. 2011;118(23):5989–5995. - PubMed
    1. Barlogie B, Anaissie E, van Rhee F, et al. Incorporating bortezomib into upfront treatment for multiple myeloma: early results of total therapy 3. Br J Haematol. 2007;138(2):176–185. - PubMed
    1. Nair B, van Rhee F, Shaughnessy JD, Jr, et al. Superior results of Total Therapy 3 (2003-33) in gene expression profiling-defined low-risk multiple myeloma confirmed in subsequent trial 2006-66 with VRD maintenance. Blood. 2010;115(21):4168–4173. - PMC - PubMed

Publication types

MeSH terms

Associated data