

Lineage mapping and characterization of the native progenitor population in cellular allograft
- PMID: 23305812
- PMCID: PMC3893135
- DOI: 10.1016/j.spinee.2012.11.017
Lineage mapping and characterization of the native progenitor population in cellular allograft
Abstract
Background context: The gold standard for bone grafting remains the autograft. However, the attractiveness of autograft is counterbalanced by donor site morbidity. To mimic autograft-and its fundamental properties of osteoconductivity, osteoinductivity, and osteogenicity-novel bone grafting materials such as cellular allograft (Osteocel Plus) are composed of allograft in which the progenitor cells are preserved. However, the true identity of these cells remains obscure largely due to the lack of specific bona fide antigenic markers for stem versus progenitor cells.
Purpose: To characterize the stem and progenitor population in cellular allograft, Osteocel Plus.
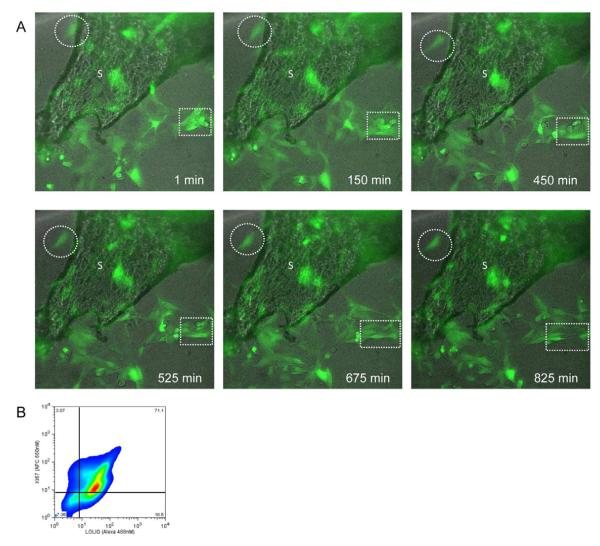
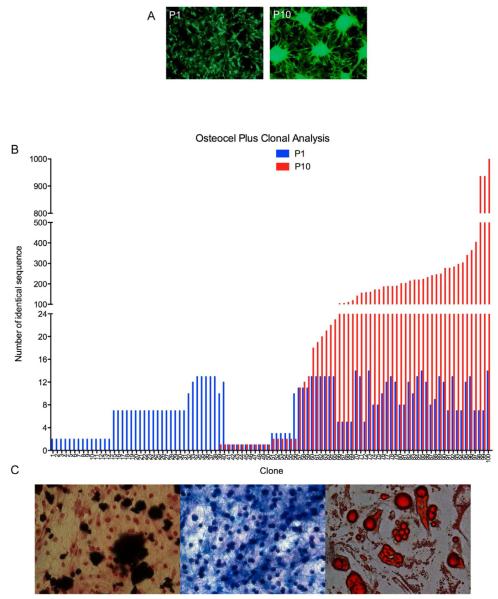
Study design: To determine whether cells endogenous to a cellular allograft undergo extensive self-renewal (a functional hallmark of stem cells), we employed a novel use of lineage mapping using a modern and refined replication incompetent lentiviral library with high complexity to uniquely label single cells with indelible genetic tags faithfully passed on to all progeny, allowing identification of highly proliferative clones. We used genetic and proteomic profiling as well as functional assays to show that these cells are capable of multipotential differentiation (the second functional hallmark of stem cells). Use of these two functional hallmarks enabled us to establish the existence of a stem and progenitor cell population in cellular allografts.
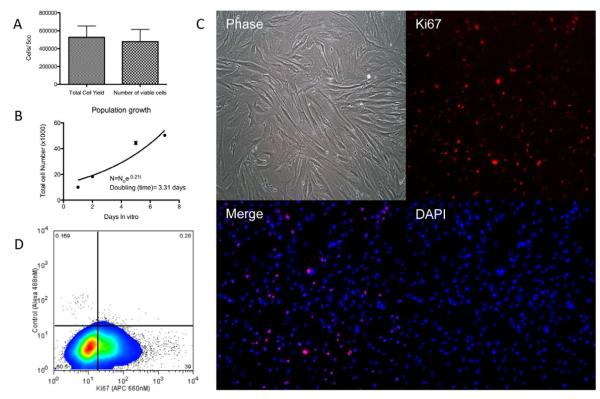
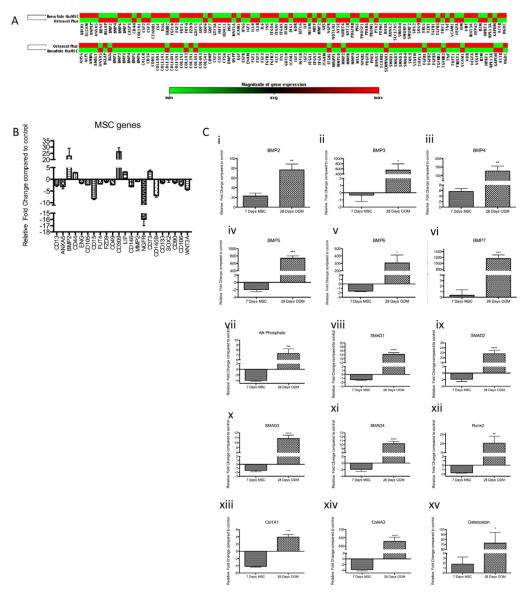
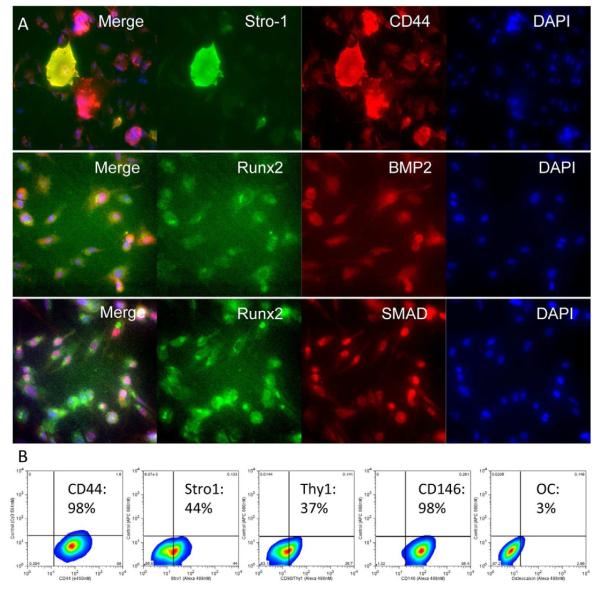
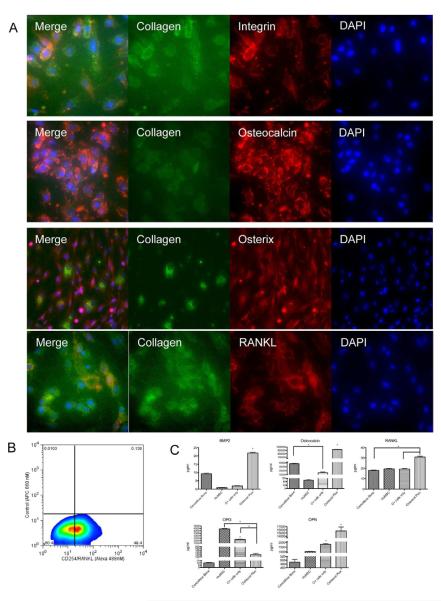
Methods: Specifically, we employed (1) cellular dissociation and (2) in vitro expansion and differentiation capacity of cells released from cellular allograft. We determined differential gene expression profiling of a bona fide human mesenchymal stem cell line and cells from cellular allograft using focused PCR arrays mesenchymal stem cell (MSC) and osteogenesis associated. Proteomic profiling of cells from cellular allograft was performed using (1) immunofluorescence for BMP-2, Runx2 SMADs, CD44, Stro-1, Collagen, RANKL, Osterix Osteocalcin, and Ki67; (2) flow cytometry for Ki67, CD44, Stro-1, Thy1, CD146, and Osteocalcin; and (3) enzyme-linked immunosorbent assays (ELISA) for BMP-2, Osteocalcin, RANKL, Osteoprotegrin, and Osteocalcin. Clonal analysis of cells from cellular allograft was performed utilizing advance lentivirus lineage mapping techniques and massive parallel sequencing. Alizarin Red, Alcian Blue, and Oil red O staining assessed tripotential differentiation capacity.
Results: Serial trypsinization of allograft cellular bone matrix yielded approximately 1×10⁵ cells per mL with viability greater than 90%. Cells expressed a panel of 84 MSC-associated genes in a pattern similar to but not identical to pure MSCs; specifically, 59 of 84 genes showed less than a 2.5-fold change in both cell types. Protein analysis showed that cellular allograft -derived cells maintained in nondifferentiation media expressed the early osteo-progenitor markers BMP-2, SMADs, and Runx2. Corresponding flow cytometry data for MSC markers revealed the presence of Stro-1 (49%), CD44 (99%), CD90 (42%), and CD146 (97%). Lineage mapping indicated that 62% of clones persisted and generated progeny through 10 passages, strongly suggesting the presence of bona fide stem cells. Passage 10 clones also exhibited tri-lineage differentiation capacity into osteogenic (Alizarin Red with H&E counterstain), chondrogenic (Alcian Blue), and adipogenic (Oil red O). Cells that did not proliferate through 10 passages presumably differentiated along an osteo-progenitor lineage.
Conclusion: These data indicate that cellular allograft (Osteocel Plus) contains a heterogeneous population of cells with most cells demonstrating the capacity for extensive self-renewal and multipotential differentiation, which are hallmarks of stem cells. Whether stem cell-enriched allografts function comparably to autograft will require further studies, and their efficacy in facilitating arthrodesis will depend on randomized clinical studies.
Copyright © 2013 Elsevier Inc. All rights reserved.
Figures
Similar articles
-
Isolation and characterization of multipotent mesenchymal stem cells in nasal polyps.Exp Biol Med (Maywood). 2015 Feb;240(2):185-93. doi: 10.1177/1535370214553898. Epub 2014 Oct 6. Exp Biol Med (Maywood). 2015. PMID: 25294891 Free PMC article. Clinical Trial.
-
Characterization of long-term in vitro culture-related alterations of human tonsil-derived mesenchymal stem cells: role for CCN1 in replicative senescence-associated increase in osteogenic differentiation.J Anat. 2014 Nov;225(5):510-8. doi: 10.1111/joa.12229. Epub 2014 Aug 23. J Anat. 2014. PMID: 25155898 Free PMC article.
-
Isolation and prolonged expansion of oral mesenchymal stem cells under clinical-grade, GMP-compliant conditions differentially affects "stemness" properties.Stem Cell Res Ther. 2017 Nov 2;8(1):247. doi: 10.1186/s13287-017-0705-0. Stem Cell Res Ther. 2017. PMID: 29096714 Free PMC article.
-
[The Role of Histone Demethylase in Osteogenic and Chondrogenic Differentiation of Mesenchymal Stem Cells: A Literature Review].Sichuan Da Xue Xue Bao Yi Xue Ban. 2021 May;52(3):364-372. doi: 10.12182/20210560202. Sichuan Da Xue Xue Bao Yi Xue Ban. 2021. PMID: 34018352 Free PMC article. Review. Chinese.
-
Regulatory of miRNAs in tri-lineage differentiation of C3H10T1/2.Stem Cell Res Ther. 2022 Nov 22;13(1):521. doi: 10.1186/s13287-022-03205-3. Stem Cell Res Ther. 2022. PMID: 36414991 Free PMC article. Review.
Cited by
-
Ordinary and Activated Bone Grafts: Applied Classification and the Main Features.Biomed Res Int. 2015;2015:365050. doi: 10.1155/2015/365050. Epub 2015 Nov 15. Biomed Res Int. 2015. PMID: 26649300 Free PMC article. Review.
-
Multipotential stromal cell abundance in cellular bone allograft: comparison with fresh age-matched iliac crest bone and bone marrow aspirate.Regen Med. 2014;9(5):593-607. doi: 10.2217/rme.14.17. Epub 2014 Mar 12. Regen Med. 2014. PMID: 24617969 Free PMC article.
-
Comparative Efficacy of Commonly Available Human Bone Graft Substitutes as Tested for Posterolateral Fusion in an Athymic Rat Model.Int J Spine Surg. 2019 Oct 31;13(5):437-458. doi: 10.14444/6059. eCollection 2019 Oct. Int J Spine Surg. 2019. PMID: 31745449 Free PMC article.
-
Dioscin stimulates differentiation of mesenchymal stem cells towards hypertrophic chondrocytes in vitro and endochondral ossification in vivo.Am J Transl Res. 2016 Sep 15;8(9):3930-3938. eCollection 2016. Am J Transl Res. 2016. PMID: 27725872 Free PMC article.
-
Allogeneic morphogenetic protein vs. recombinant human bone morphogenetic protein-2 in lumbar interbody fusion procedures: a radiographic and economic analysis.J Orthop Surg Res. 2013 Dec 28;8:49. doi: 10.1186/1749-799X-8-49. J Orthop Surg Res. 2013. PMID: 24373225 Free PMC article.
References
-
- Bueno EM, Glowacki J. Cell-free and cell-based approaches for bone regeneration. Nat Rev Rheumatol. 2009;5:685–97. - PubMed
-
- Delecrin J, Takahashi S, Gouin F, Passuti N. A synthetic porous ceramic as a bone graft substitute in the surgical management of scoliosis: a prospective, randomized study. Spine (Phila Pa 1976) 2000;25:563–9. - PubMed
-
- Agarwal R, Williams K, Umscheid CA, Welch WC. Osteoinductive bone graft substitutes for lumbar fusion: a systematic review. J Neurosurg Spine. 2009;11:729–40. - PubMed
-
- Rihn JA, Kirkpatrick K, Albert TJ. Graft options in posterolateral and posterior interbody lumbar fusion. Spine (Phila Pa 1976) 2010;35:1629–39. - PubMed
Publication types
MeSH terms
Substances
Grants and funding
LinkOut - more resources
Full Text Sources
Other Literature Sources
Miscellaneous
