

Magnetic particle imaging (MPI) for NMR and MRI researchers
- PMID: 23305842
- PMCID: PMC3602323
- DOI: 10.1016/j.jmr.2012.11.029
Magnetic particle imaging (MPI) for NMR and MRI researchers
Abstract
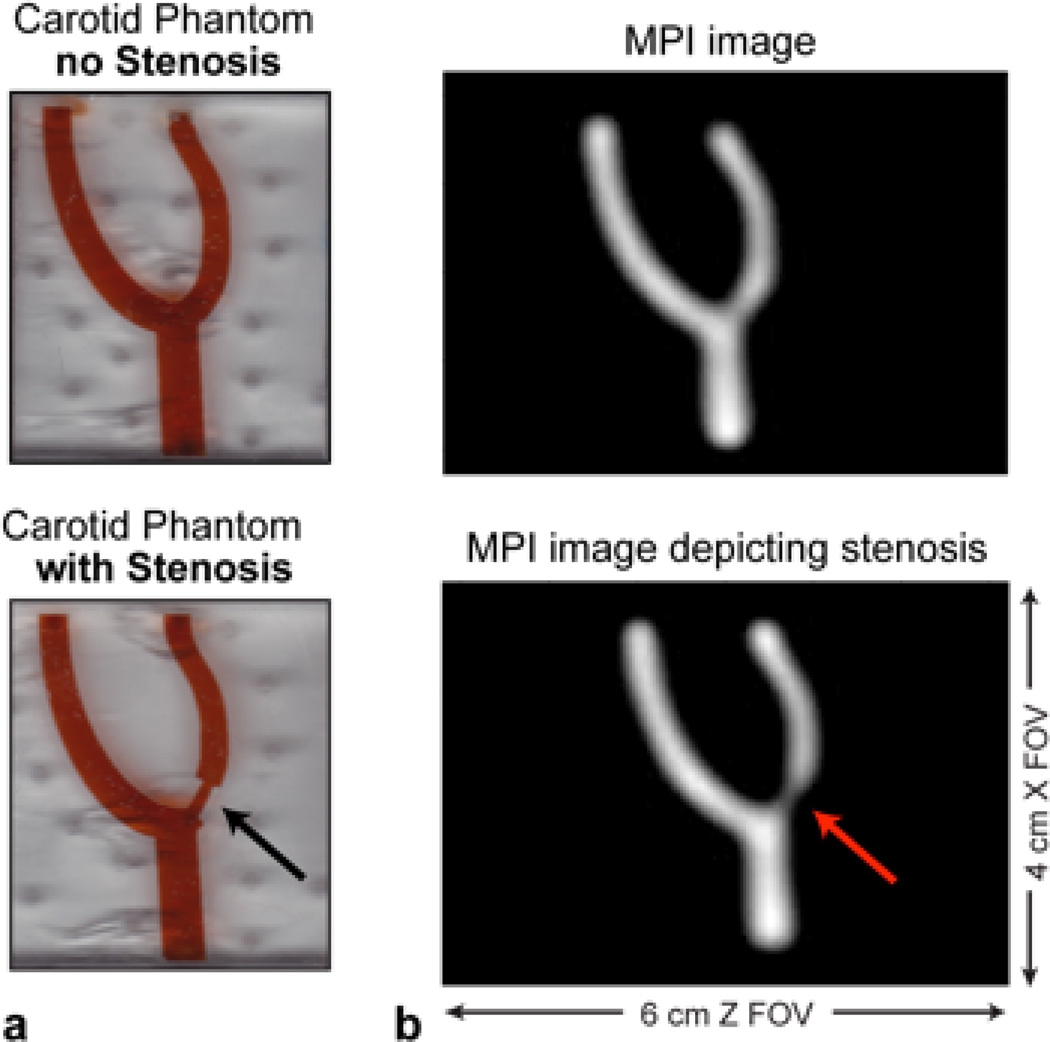
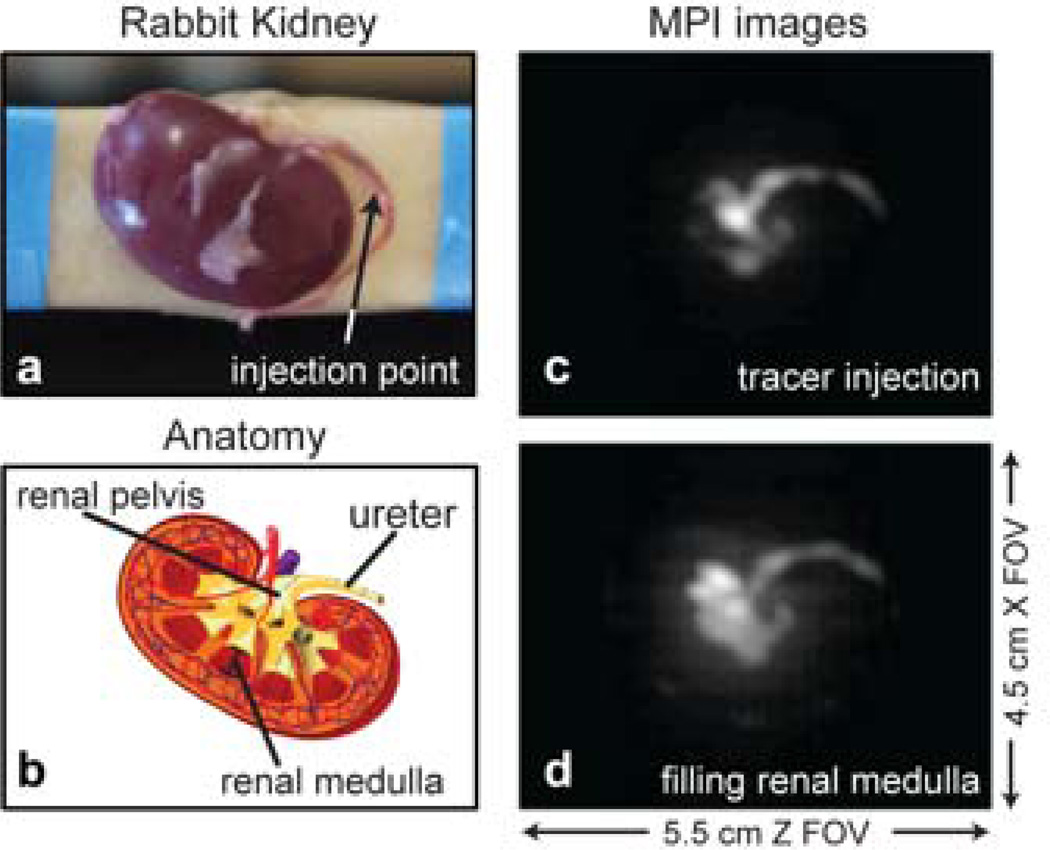
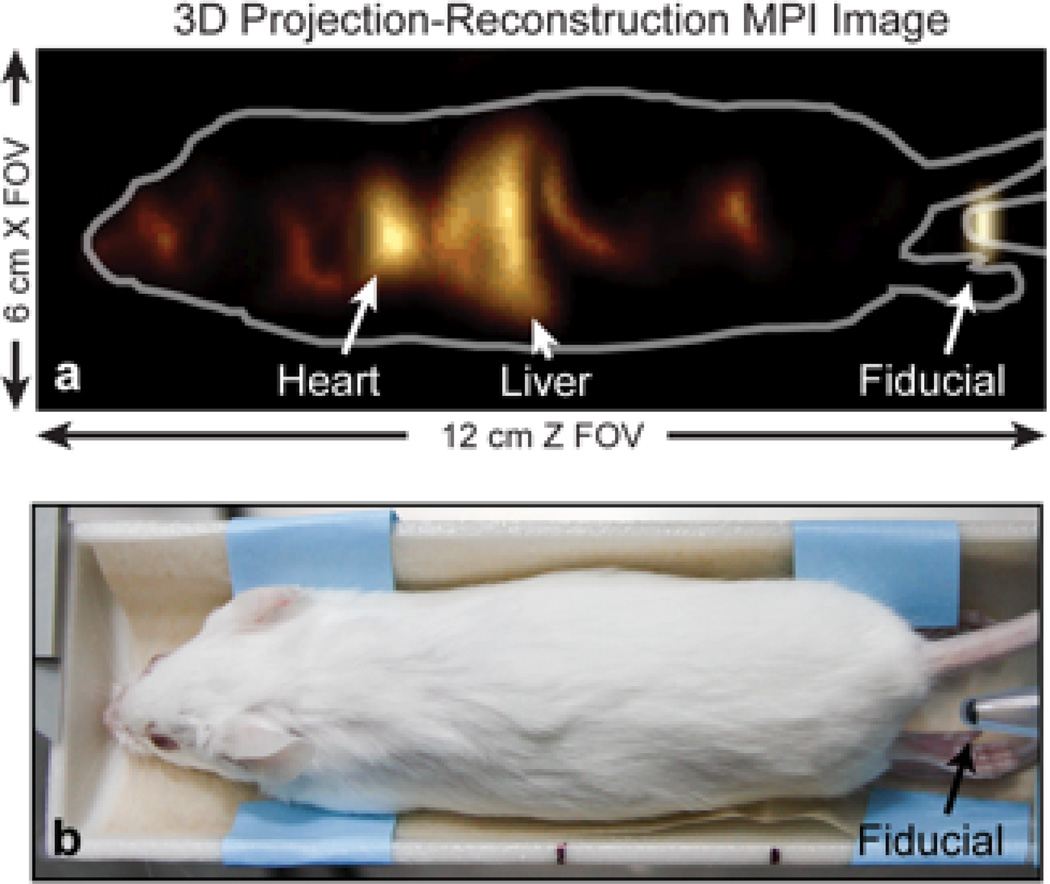
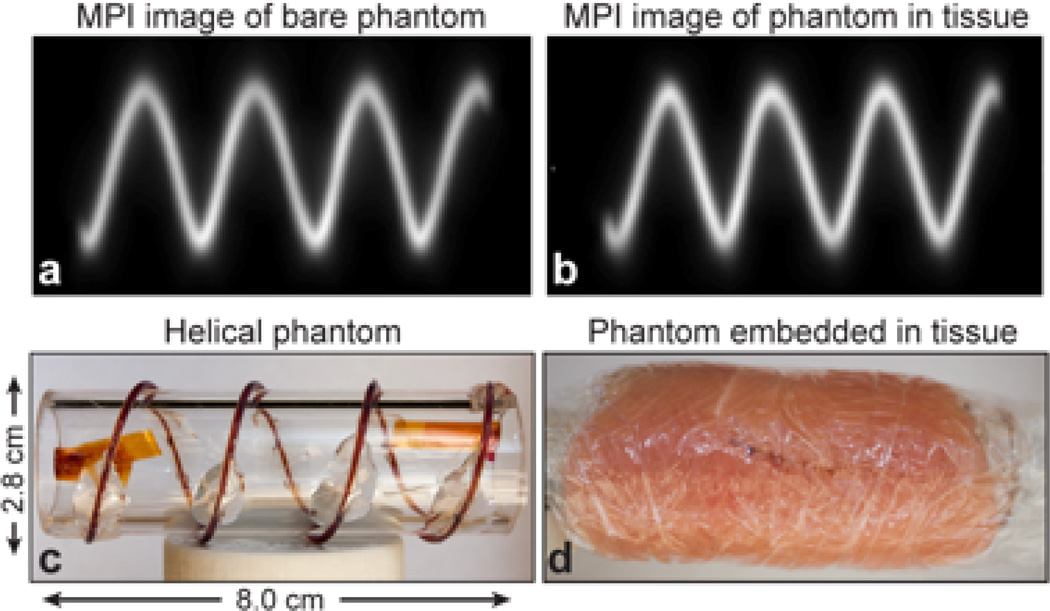
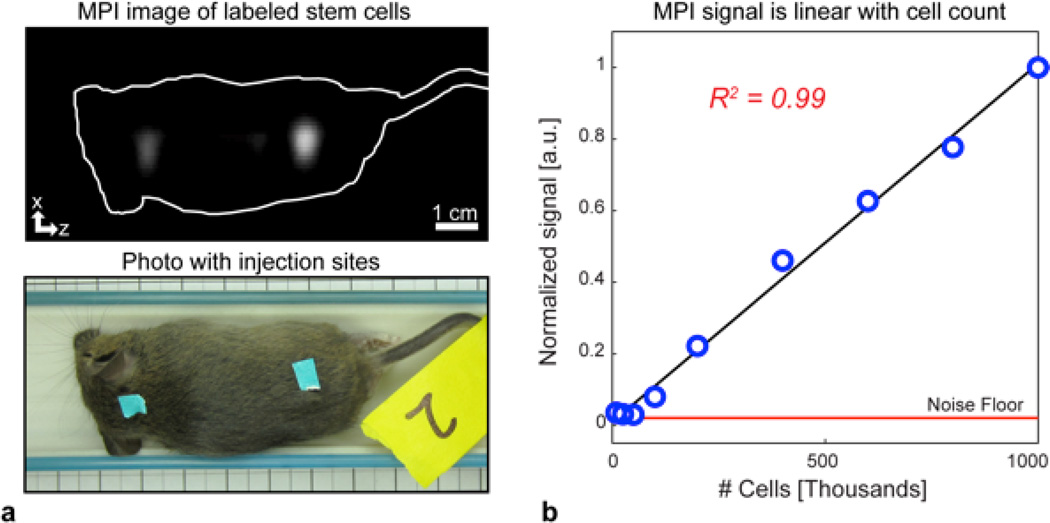
Magnetic Particle Imaging (MPI) is a new tracer imaging modality that is gaining significant interest from NMR and MRI researchers. While the physics of MPI differ substantially from MRI, it employs hardware and imaging concepts that are familiar to MRI researchers, such as magnetic excitation and detection, pulse sequences, and relaxation effects. Furthermore, MPI employs the same superparamagnetic iron oxide (SPIO) contrast agents that are sometimes used for MR angiography and are often used for MRI cell tracking studies. These SPIOs are much safer for humans than iodine or gadolinium, especially for Chronic Kidney Disease (CKD) patients. The weak kidneys of CKD patients cannot safely excrete iodine or gadolinium, leading to increased morbidity and mortality after iodinated X-ray or CT angiograms, or after gadolinium-MRA studies. Iron oxides, on the other hand, are processed in the liver, and have been shown to be safe even for CKD patients. Unlike the "black blood" contrast generated by SPIOs in MRI due to increased T2* dephasing, SPIOs in MPI generate positive, "bright blood" contrast. With this ideal contrast, even prototype MPI scanners can already achieve fast, high-sensitivity, and high-contrast angiograms with millimeter-scale resolutions in phantoms and in animals. Moreover, MPI shows great potential for an exciting array of applications, including stem cell tracking in vivo, first-pass contrast studies to diagnose or stage cancer, and inflammation imaging in vivo. So far, only a handful of prototype small-animal MPI scanners have been constructed worldwide. Hence, MPI is open to great advances, especially in hardware, pulse sequence, and nanoparticle improvements, with the potential to revolutionize the biomedical imaging field.
Copyright © 2012 Elsevier Inc. All rights reserved.
Figures
Similar articles
-
X-space MPI: magnetic nanoparticles for safe medical imaging.Adv Mater. 2012 Jul 24;24(28):3870-7. doi: 10.1002/adma.201200221. Adv Mater. 2012. PMID: 22988557 Review.
-
Magnetic particle imaging: introduction to imaging and hardware realization.Z Med Phys. 2012 Dec;22(4):323-34. doi: 10.1016/j.zemedi.2012.07.004. Epub 2012 Aug 19. Z Med Phys. 2012. PMID: 22909418 Review.
-
Magnetic particle imaging for radiation-free, sensitive and high-contrast vascular imaging and cell tracking.Curr Opin Chem Biol. 2018 Aug;45:131-138. doi: 10.1016/j.cbpa.2018.04.014. Epub 2018 May 10. Curr Opin Chem Biol. 2018. PMID: 29754007 Free PMC article. Review.
-
Janus Iron Oxides @ Semiconducting Polymer Nanoparticle Tracer for Cell Tracking by Magnetic Particle Imaging.Nano Lett. 2018 Jan 10;18(1):182-189. doi: 10.1021/acs.nanolett.7b03829. Epub 2017 Dec 15. Nano Lett. 2018. PMID: 29232142 Free PMC article.
-
Superparamagnetic iron oxides as MPI tracers: A primer and review of early applications.Adv Drug Deliv Rev. 2019 Jan 1;138:293-301. doi: 10.1016/j.addr.2018.12.007. Epub 2018 Dec 13. Adv Drug Deliv Rev. 2019. PMID: 30552918 Free PMC article. Review.
Cited by
-
In vivo tracking and quantification of inhaled aerosol using magnetic particle imaging towards inhaled therapeutic monitoring.Theranostics. 2018 Jun 8;8(13):3676-3687. doi: 10.7150/thno.26608. eCollection 2018. Theranostics. 2018. PMID: 30026874 Free PMC article.
-
Twenty-fold acceleration of 3D projection reconstruction MPI.Biomed Tech (Berl). 2013 Dec;58(6):565-76. doi: 10.1515/bmt-2012-0062. Biomed Tech (Berl). 2013. PMID: 23940058 Free PMC article.
-
Inter-user Comparison for Quantification of Superparamagnetic Iron Oxides with Magnetic Particle Imaging Across Two Institutions Highlights a Need for Standardized Approaches.Mol Imaging Biol. 2023 Oct;25(5):954-967. doi: 10.1007/s11307-023-01829-2. Epub 2023 Jun 29. Mol Imaging Biol. 2023. PMID: 37386319
-
Quantitative Magnetic Particle Imaging Monitors the Transplantation, Biodistribution, and Clearance of Stem Cells In Vivo.Theranostics. 2016 Jan 1;6(3):291-301. doi: 10.7150/thno.13728. eCollection 2016. Theranostics. 2016. PMID: 26909106 Free PMC article.
-
Localization and Actuation for MNPs Based on Magnetic Field-Free Point: Feasibility of Movable Electromagnetic Actuations.Micromachines (Basel). 2020 Nov 21;11(11):1020. doi: 10.3390/mi11111020. Micromachines (Basel). 2020. PMID: 33233414 Free PMC article.
References
-
- Gleich B, Weizenecker R. Tomographic imaging using the nonlinear response of magnetic particles. Nature. 2005;435:1214–1217. - PubMed
-
- Ljunggren S. A Simple Graphical Representation of Fourier-Based Imaging Methods. J Magn Reson. 1983;54:338–343.
-
- Twieg DB. The K-Trajectory Formulation of the Nmr Imaging Process with Applications in Analysis and Synthesis of Imaging Methods. Med Phys. 1983;10:610–621. - PubMed
-
- Jiaquan Xu KDK, Murphy Sherry L, Tejada-Vera Betzaida. Deaths: Final Data for 2007, CDC: National Vital Statistics Reports. 2010;58 - PubMed
-
- Katzberg RW, Haller C. Contrast-induced nephrotoxicity: clinical landscape. Kidney Int Suppl. 2006:S3–S7. - PubMed
Publication types
MeSH terms
Substances
Grants and funding
LinkOut - more resources
Full Text Sources
Other Literature Sources
Medical
