Clinical Trial
. 2013 Aug 15;188(4):492-502.
doi: 10.1164/rccm.201208-1385OC.

Induction and regulation of T-cell immunity by the novel tuberculosis vaccine M72/AS01 in South African adults

Affiliations
Clinical Trial

Induction and regulation of T-cell immunity by the novel tuberculosis vaccine M72/AS01 in South African adults

Cheryl L Day et al. Am J Respir Crit Care Med. .

Abstract

Rationale: Tuberculosis (TB) is a major cause of morbidity and mortality worldwide, thus there is an urgent need for novel TB vaccines.

Objectives: We investigated a novel TB vaccine candidate, M72/AS01, in a phase IIa trial of bacille Calmette-Guérin-vaccinated, HIV-uninfected, and Mycobacterium tuberculosis (Mtb)-infected and -uninfected adults in South Africa.

Methods: Two doses of M72/AS01 were administered to healthy adults, with and without latent Mtb infection. Participants were monitored for 7 months after the first dose; cytokine production profiles, cell cycling, and regulatory phenotypes of vaccine-induced T cells were measured by flow cytometry.

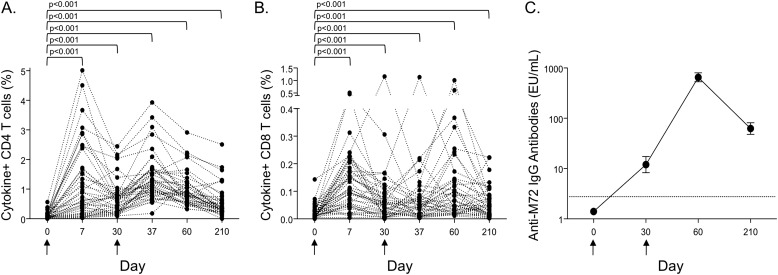
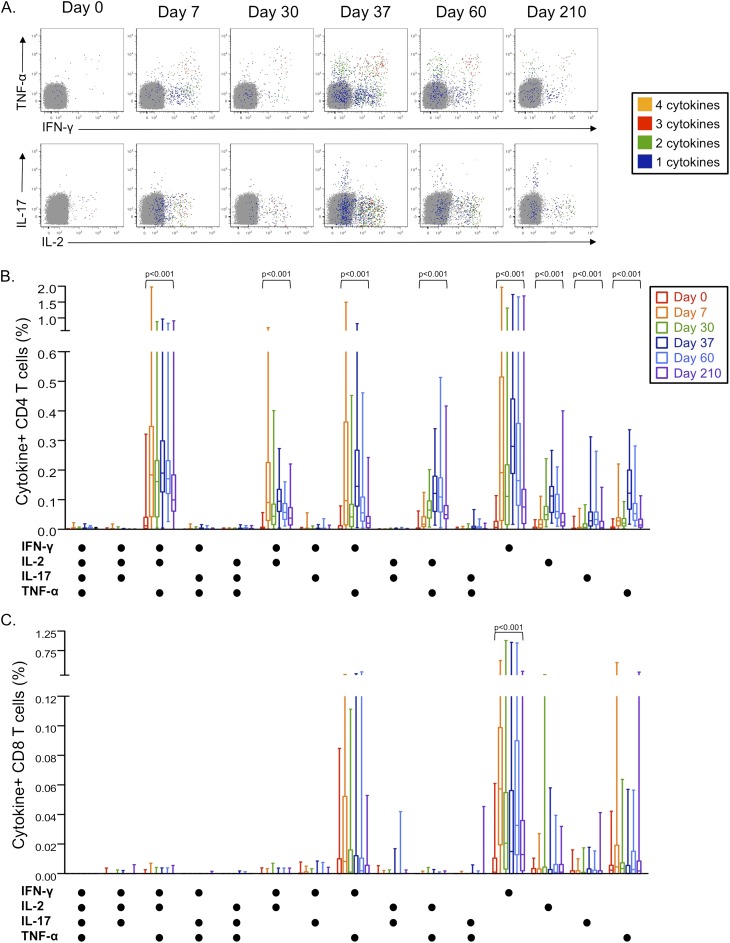
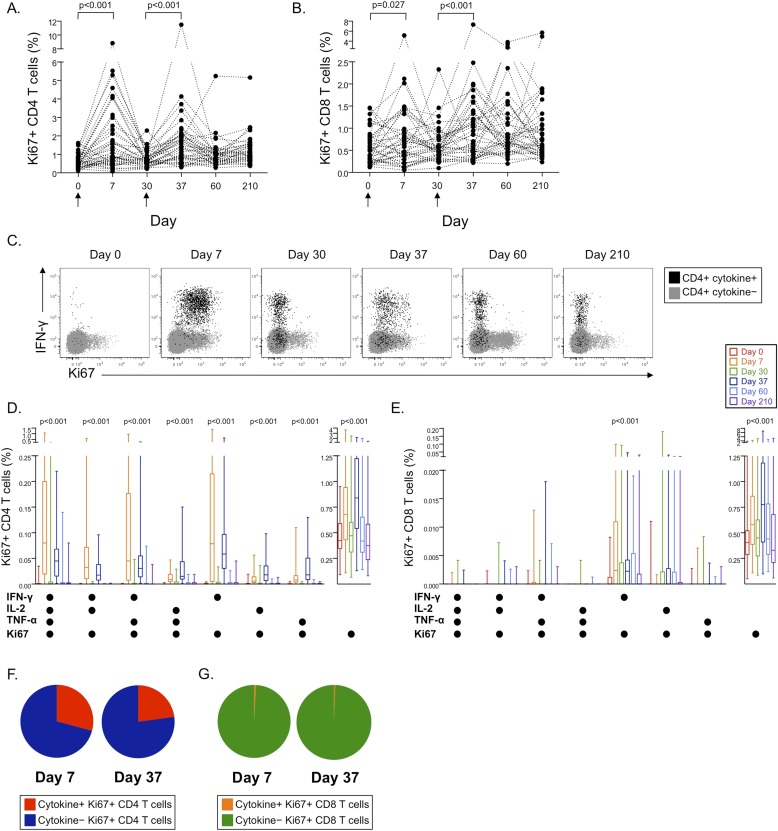
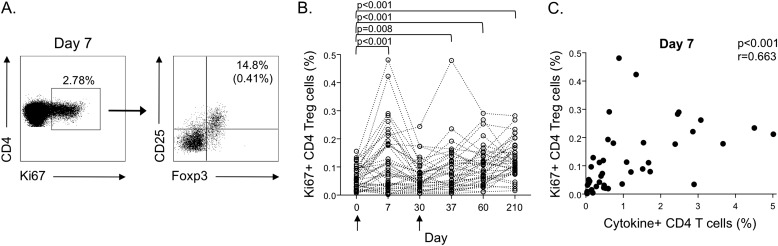
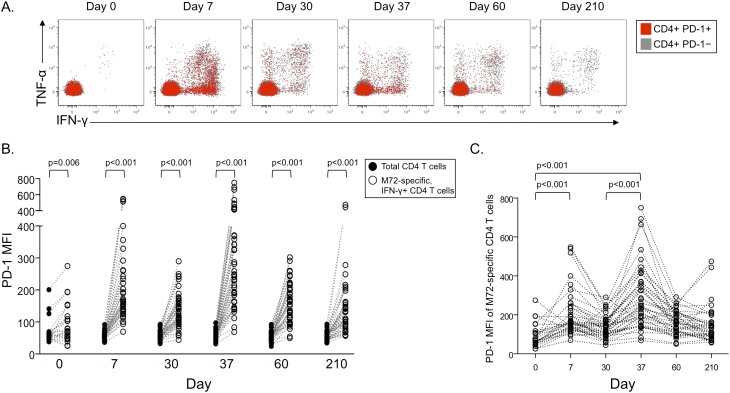
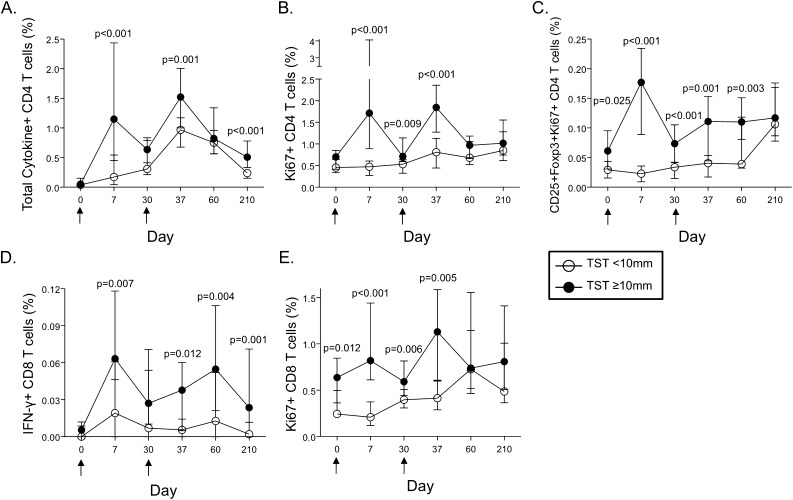
Measurements and main results: The vaccine had a clinically acceptable safety profile, and induced robust, long-lived M72-specific T-cell and antibody responses. M72-specific CD4 T cells produced multiple combinations of Th1 cytokines. Analysis of T-cell Ki67 expression showed that most vaccination-induced T cells did not express Th1 cytokines or IL-17; these cytokine-negative Ki67(+) T cells included subsets of CD4 T cells with regulatory phenotypes. PD-1, a negative regulator of activated T cells, was transiently expressed on M72-specific CD4 T cells after vaccination. Specific T-cell subsets were present at significantly higher frequencies after vaccination of Mtb-infected versus -uninfected participants.

Conclusions: M72/AS01 is clinically well tolerated in Mtb-infected and -uninfected adults, induces high frequencies of multifunctional T cells, and boosts distinct T-cell responses primed by natural Mtb infection. Moreover, these results provide important novel insights into how this immunity may be appropriately regulated after novel TB vaccination of Mtb-infected and -uninfected individuals.

Clinical trial registered with www.clinicaltrials.gov (NCT 00600782).


Figures

<i>Figure 1.</i>
Figure 1.
M72/AS01 induces T-cell and humoral immunity. The longitudinal kinetics of M72/AS01-induced CD4 and CD8 T-cell responses were assessed by an intracellular cytokine staining assay after stimulation of whole blood with M72 protein. (A and B) The sum total frequency of IFN-γ, IL-2, tumor necrosis factor-α, and IL-17–positive CD4 and CD8 T cells; each line represents a different individual (n = 42). Results are shown after background subtraction of cytokine production in the negative control sample. (C) The geometric mean and 95% confidence interval (CI) of anti-M72 IgG antibodies in serum are shown on the day of vaccination (Day 0; n = 43), and Days 30 (n = 42), 60 (n = 43), and 210 (n = 43) after vaccination. The dotted line indicates the limit of detection of the assay (2.8 ELISA units/ml). Arrows under the x axis indicate days on which the M72/AS01 vaccine was administered.
<i>Figure 2.</i>
Figure 2.
Vaccination with M72/AS01 induces multiple distinct populations of cytokine-producing CD4 and CD8 T cells. M72-specific CD4 and CD8 T cells producing IFN-γ, tumor necrosis factor (TNF)-α, IL-2 and IL-17 were measured by an ICS assay after stimulation of whole blood with M72 protein. (A) Representative whole blood intracellular cytokine staining flow cytometry data are shown for M72-specific CD4 T cells producing each cytokine. Plots are shown gated on CD3+CD4+ lymphocytes, with colored cells indicating populations of M72-specific CD4 T cells producing four cytokines (orange), three cytokines (red), two cytokines (green), or one cytokine (blue). The frequency of M72-specific CD4 (B) and CD8 T cells (C) producing each combination of IFN-γ, TNF-α, IL-2, and IL-17 are shown. Results are shown after subtraction of background cytokine production in the negative control sample. Statistical differences across the time points within each subset were assessed by the Friedman test. The Wilcoxon matched-pairs test was used to compare the frequency of M72-specific CD4 T-cell responses between two time points within each subset; the Wilcoxon P value is shown for comparisons between Days 0 and 210 for specific cytokine-producing CD4 and CD8 T-cell subsets.
<i>Figure 3.</i>
Figure 3.
Vaccination with M72/AS01 induces distinct populations of cycling Ki67+ CD4 and CD8 T cells 7 days after each vaccination. Intracellular Ki67 expression was measured in whole blood directly ex vivo at each time point for CD4 (A) and CD8 T cells (B). Differences in Ki67 expression were assessed between Days 0 and 7 and Days 30 and 37 using the Wilcoxon matched-pairs test. (C) Coexpression of Ki67 within cytokine-producing populations of M72-specific T cells was determined in the whole blood intracellular cytokine staining assay after stimulation with M72 protein. Longitudinal representative flow cytometry data are shown from a single vaccinated donor indicating coexpression patterns of Ki67 and cytokines by M72-specific CD4 T cells. Plots are shown gated on CD3+CD4+ lymphocytes. Gray dots indicate cytokine-negative CD4 T cells; black dots indicate all cytokine-positive CD4 T cells producing any combination of IFN-γ, tumor necrosis factor (TNF)-α, IL-2, or IL-17. Summary data of the frequencies of Ki67+ CD4 (D) or CD8 (E) T cells expressing each combination of cytokines, or no cytokines, are shown at each time point (n = 42). The proportions of cytokine-positive and cytokine-negative cells contributing to the total Ki67+ CD4 (F) and CD8 T-cell response (G) are shown 7 days after each vaccination. Differences in the frequencies of T cells within each subset over time were assessed using the Friedman test. Friedman test P values are shown for each subset where there was a significant difference in Ki67 expression over time.
<i>Figure 4.</i>
Figure 4.
Ki67+ CD4 T cells induced after M72/AS01 vaccination contain distinct populations with regulatory phenotypes. Ki67-expressing CD4 T cells were assessed in whole blood directly ex vivo for expression of CD25, Foxp3, and CD45RA. (A) Representative flow cytometry data of CD4 Tregs (defined as CD25+Foxp3+) from a single donor at Day 7 post-vaccination. The plot on the left is gated on CD3+ T cells; the plot on the right is gated on CD3+CD4+Ki67+ cells. The percentage in the upper right quadrant indicates the percentage of Ki67+ CD4 T cells that are Tregs. The percentage in parentheses indicates the frequency of Ki67+ Tregs of the total CD4 T cell population. (B) Summary data of the frequency of Ki67+ Tregs of the total CD4 T-cell population for each donor at each time point. Differences between time points were assessed using the Wilcoxon matched-pairs test. (C) Correlation between the total frequency of M72-specific cytokine-producing CD4 T cells (cells producing IFN-γ, tumor necrosis factor-α, IL-2, and IL-17 in whole blood after stimulation with M72 protein) and the frequency of ex vivo Ki67+ CD4 Tregs at Day 7 post-vaccination. Correlations were assessed using the Spearman rank test.
<i>Figure 5.</i>
Figure 5.
PD-1 is transiently up-regulated on M72-specific CD4 T cells 7 days after each vaccination. The median fluorescence intensity (MFI) of PD-1 was measured on M72-specific T cells producing either IFN-γ or tumor necrosis factor (TNF)-α in whole blood after stimulation with M72 protein. (A) Representative longitudinal flow cytometry data from a single vaccinated donor; plots are gated on CD3+CD4+ lymphocytes. Gray dots indicate PD-1–negative CD4 T cells; red dots indicate PD-1–positive CD4 T cells. (B) Comparison of PD-1 MFI between total CD4 T cells (black circles) and M72-specific (IFN-γ–positive; open circles) CD4 T cells. Only individuals with IFN-γ–positive M72-specific CD4 T-cell responses are shown at each time point (Day 0, n = 24; Day 7, n = 41; Day 30, n = 41; Day 37, n = 43; Day 60, n = 43; Day 210, n = 42). Differences between PD-1 expression on total CD4 T cells and M72-specific CD4 T cells at each time point were determined by the Wilcoxon matched-pairs test. (C) Longitudinal analysis of PD-1 MFI on M72-specific IFN-γ–positive CD4 T-cell responses on an individual donor basis. Differences in PD-1 MFI on M72-specific CD4 T cells between time points were determined by the Mann-Whitney test.
<i>Figure 6.</i>
Figure 6.
Increased frequencies of specific subsets of M72-specific CD4 and CD8 T cells after M72/AS01 vaccination of Mycobacterium tuberculosis–infected participants, compared with uninfected participants. M72-specific CD4 and CD8 T-cell responses were assessed in all vaccinated donors with a whole blood intracellular cytokine staining assay, as described in Figures 1 and 2. (A) The total frequency of cytokine-producing M72-specific CD4 T cells and IFN-γ–producing M72-specific CD8 T cells (D) were compared between the tuberculin skin test (TST) less than 10 mm and greater than or equal to 10 mm subgroups (n = 14 and n = 28, respectively). (B) Comparison of the total frequency of Ki67+ CD4 T cells and Ki67+ CD4 Treg cells (C) between the TST less than 10 mm and greater than or equal to 10 mm subgroups (n = 15 and n = 26, respectively). (E) Comparison of the total frequency of Ki67+ CD8 T cells between the TST less than 10 mm and greater than or equal to 10 mm subgroups (n = 15 and n = 26, respectively). The median and interquartile ranges are shown for each group at each time point. Open circles represent the TST less than 10 mm subgroup and black circles represent the TST greater than or equal to 10 mm subgroup. For all analyses, differences between the groups at each time point were assessed by the Mann-Whitney test.

Similar articles

Cited by

References

    1. World Health OrganizationGlobal tuberculosis control 2011 [accessed 2011 Dec 6]. Available from: http://www.who.int/tb/publications/global_report/en/index.html
    1. Rodrigues LC, Diwan VK, Wheeler JG. Protective effect of BCG against tuberculous meningitis and miliary tuberculosis: a meta-analysis. Int J Epidemiol. 1993;22:1154–1158. - PubMed
    1. Colditz GA, Brewer TF, Berkey CS, Wilson ME, Burdick E, Fineberg HV, Mosteller F. Efficacy of BCG vaccine in the prevention of tuberculosis: meta-analysis of the published literature. JAMA. 1994;271:698–702. - PubMed
    1. Rappuoli R, Aderem A. A 2020 vision for vaccines against HIV, tuberculosis and malaria. Nature. 2011;473:463–469. - PubMed
    1. Casella CR, Mitchell TC. Putting endotoxin to work for us: monophosphoryl lipid A as a safe and effective vaccine adjuvant. Cell Mol Life Sci. 2008;65:3231–3240. - PMC - PubMed

Publication types