

Physico-chemical foundations underpinning microarray and next-generation sequencing experiments
- PMID: 23307556
- PMCID: PMC3597649
- DOI: 10.1093/nar/gks1358
Physico-chemical foundations underpinning microarray and next-generation sequencing experiments
Abstract
Hybridization of nucleic acids on solid surfaces is a key process involved in high-throughput technologies such as microarrays and, in some cases, next-generation sequencing (NGS). A physical understanding of the hybridization process helps to determine the accuracy of these technologies. The goal of a widespread research program is to develop reliable transformations between the raw signals reported by the technologies and individual molecular concentrations from an ensemble of nucleic acids. This research has inputs from many areas, from bioinformatics and biostatistics, to theoretical and experimental biochemistry and biophysics, to computer simulations. A group of leading researchers met in Ploen Germany in 2011 to discuss present knowledge and limitations of our physico-chemical understanding of high-throughput nucleic acid technologies. This meeting inspired us to write this summary, which provides an overview of the state-of-the-art approaches based on physico-chemical foundation to modeling of the nucleic acids hybridization process on solid surfaces. In addition, practical application of current knowledge is emphasized.
Figures
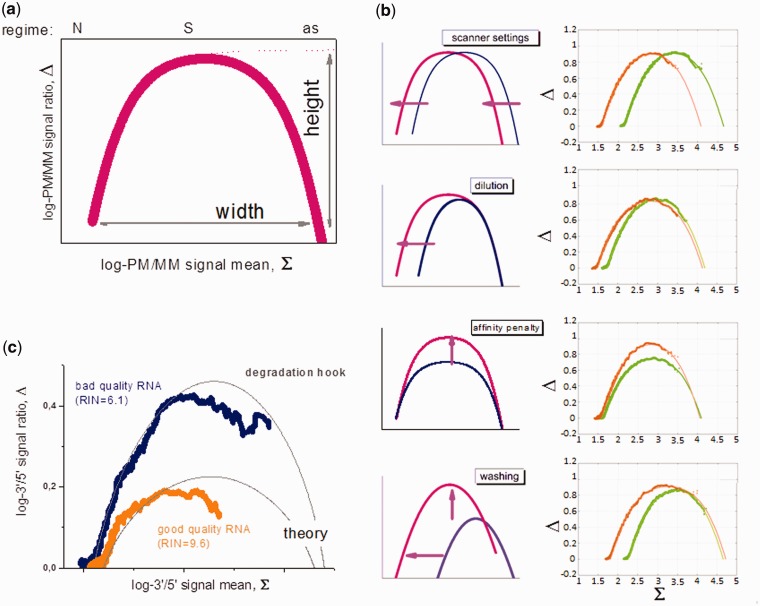
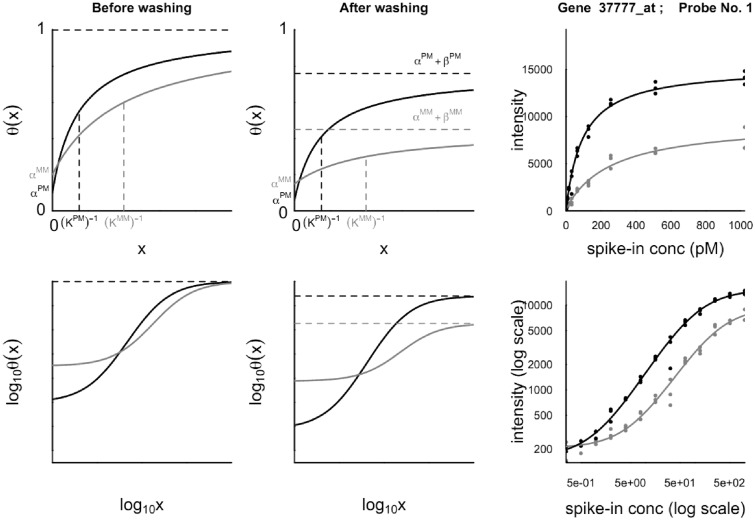
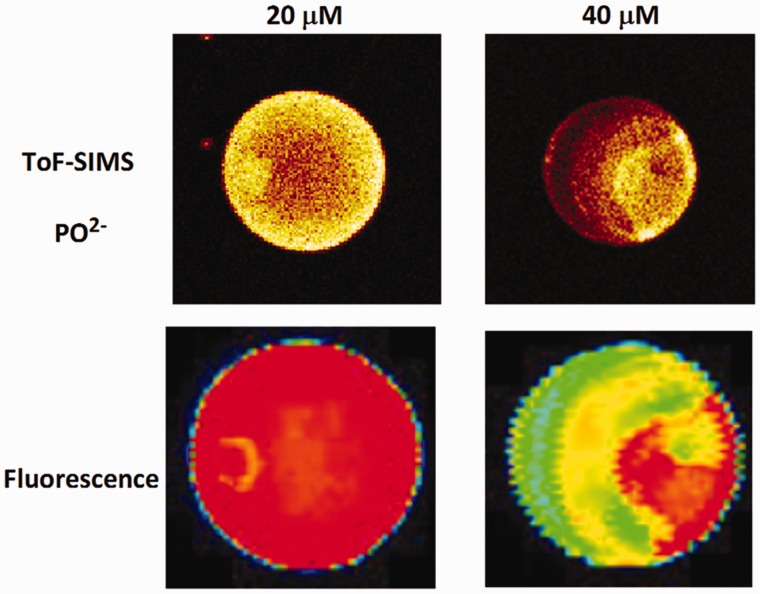
 ion in single printed DNA spots show large variability of DNA concentration in and across the microarray spots. Spots are printed from 20 and 40 μM DNA concentration drops (from left to right) with 100% of the DNA tagged with Cy3. Image size (400 × 400 μm). The Cy3 fluorescence images of the same spots are shown for comparison.
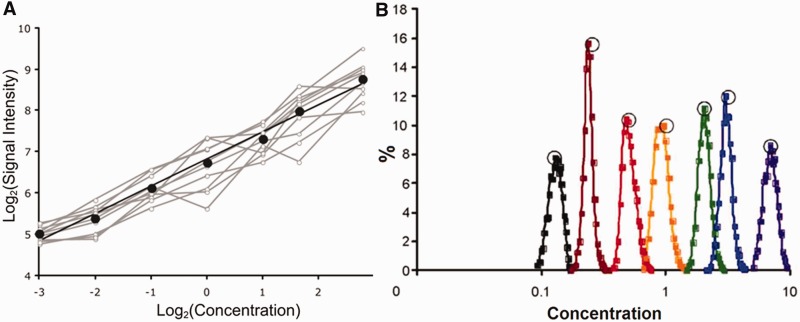
Similar articles
-
Strategies for optimizing DNA hybridization on surfaces.Anal Biochem. 2014 Jan 1;444:41-6. doi: 10.1016/j.ab.2013.09.032. Epub 2013 Oct 9. Anal Biochem. 2014. PMID: 24121011 Review.
-
Understanding the physics of oligonucleotide microarrays: the Affymetrix spike-in data reanalysed.Phys Biol. 2008 Mar 27;5(1):016004. doi: 10.1088/1478-3975/5/1/016004. Phys Biol. 2008. PMID: 18369276
-
The effects of multiple probes on the hybridization of target DNA on surfaces.J Chem Phys. 2015 Jan 7;142(1):015102. doi: 10.1063/1.4904929. J Chem Phys. 2015. PMID: 25573584
-
[Properties of hybridization isotherms upon binding of ligands on microchips].Biofizika. 2009 Sep-Oct;54(5):820-3. Biofizika. 2009. PMID: 19894619 Russian.
-
Recent patents and challenges on DNA microarray probe design technologies.Recent Pat DNA Gene Seq. 2010 Nov;4(3):210-7. doi: 10.2174/187221510794751640. Recent Pat DNA Gene Seq. 2010. PMID: 21121887 Review.
Cited by
-
Information Limited Oligonucleotide Amplification Assay for Affinity-Based, Parallel Detection Studies.PLoS One. 2016 Mar 15;11(3):e0151072. doi: 10.1371/journal.pone.0151072. eCollection 2016. PLoS One. 2016. PMID: 26978653 Free PMC article.
-
A revised design for microarray experiments to account for experimental noise and uncertainty of probe response.PLoS One. 2014 Mar 11;9(3):e91295. doi: 10.1371/journal.pone.0091295. eCollection 2014. PLoS One. 2014. PMID: 24618910 Free PMC article.
-
Thermodynamic framework to assess low abundance DNA mutation detection by hybridization.PLoS One. 2017 May 25;12(5):e0177384. doi: 10.1371/journal.pone.0177384. eCollection 2017. PLoS One. 2017. PMID: 28542229 Free PMC article.
-
Single-stranded DNA catalyzes hybridization of PCR-products to microarray capture probes.PLoS One. 2014 Jul 15;9(7):e102338. doi: 10.1371/journal.pone.0102338. eCollection 2014. PLoS One. 2014. PMID: 25025686 Free PMC article.
-
Towards microbiome transplant as a therapy for periodontitis: an exploratory study of periodontitis microbial signature contrasted by oral health, caries and edentulism.BMC Oral Health. 2015 Oct 14;15:125. doi: 10.1186/s12903-015-0109-4. BMC Oral Health. 2015. PMID: 26468081 Free PMC article.
References
-
- Amend AS, Seifert KA, Bruns TD. Quantifying microbial communities with 454 pyrosequencing, does read abundance count? Mol. Ecol. 2010;19:5555–5565. - PubMed
Publication types
MeSH terms
Substances
Grants and funding
LinkOut - more resources
Full Text Sources
Other Literature Sources
Miscellaneous
