

Reference-assisted chromosome assembly
- PMID: 23307812
- PMCID: PMC3562798
- DOI: 10.1073/pnas.1220349110
Reference-assisted chromosome assembly
Abstract
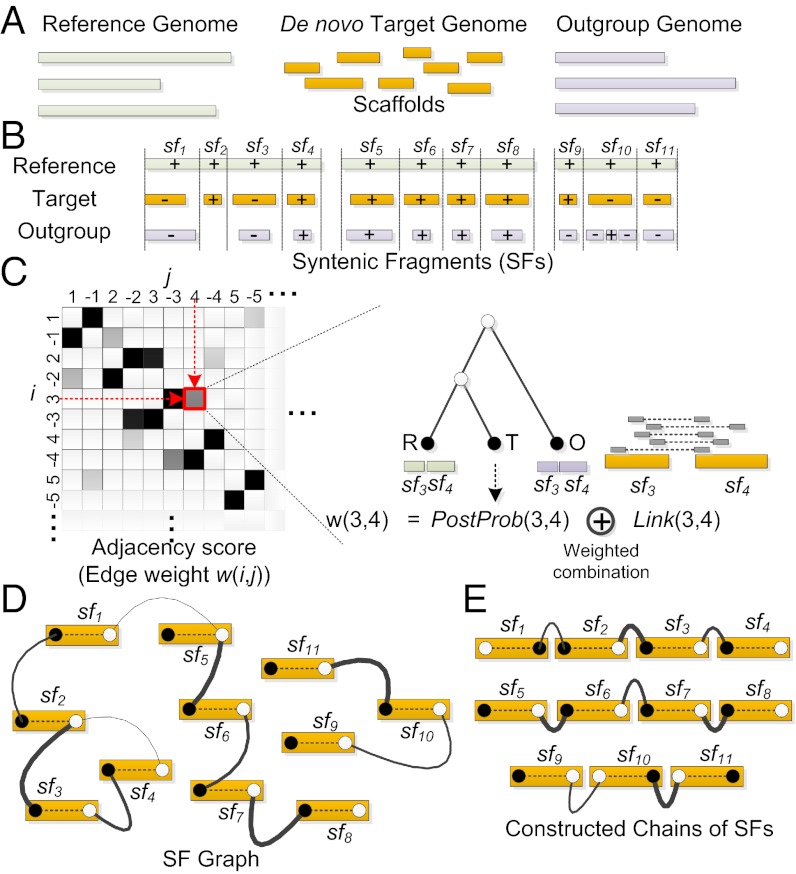
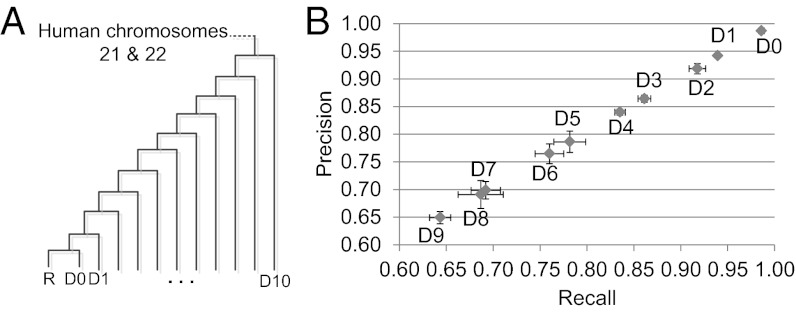
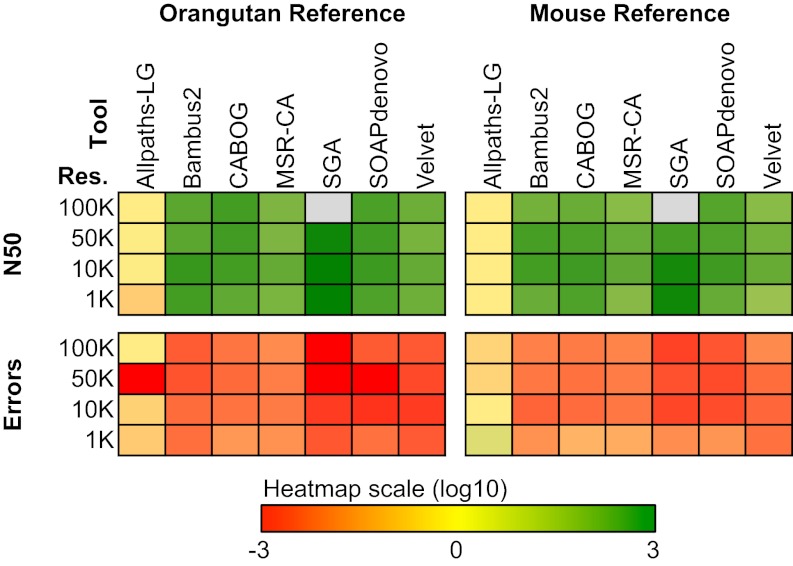
One of the most difficult problems in modern genomics is the assembly of full-length chromosomes using next generation sequencing (NGS) data. To address this problem, we developed "reference-assisted chromosome assembly" (RACA), an algorithm to reliably order and orient sequence scaffolds generated by NGS and assemblers into longer chromosomal fragments using comparative genome information and paired-end reads. Evaluation of results using simulated and real genome assemblies indicates that our approach can substantially improve genomes generated by a wide variety of de novo assemblers if a good reference assembly of a closely related species and outgroup genomes are available. We used RACA to reconstruct 60 Tibetan antelope (Pantholops hodgsonii) chromosome fragments from 1,434 SOAPdenovo sequence scaffolds, of which 16 chromosome fragments were homologous to complete cattle chromosomes. Experimental validation by PCR showed that predictions made by RACA are highly accurate. Our results indicate that RACA will significantly facilitate the study of chromosome evolution and genome rearrangements for the large number of genomes being sequenced by NGS that do not have a genetic or physical map.
Conflict of interest statement
The authors declare no conflict of interest.
Figures
Similar articles
-
An update of the goat genome assembly using dense radiation hybrid maps allows detailed analysis of evolutionary rearrangements in Bovidae.BMC Genomics. 2014 Jul 23;15(1):625. doi: 10.1186/1471-2164-15-625. BMC Genomics. 2014. PMID: 25052253 Free PMC article.
-
Construction of Red Fox Chromosomal Fragments from the Short-Read Genome Assembly.Genes (Basel). 2018 Jun 20;9(6):308. doi: 10.3390/genes9060308. Genes (Basel). 2018. PMID: 29925783 Free PMC article.
-
A near-chromosome-scale genome assembly of the gemsbok (Oryx gazella): an iconic antelope of the Kalahari desert.Gigascience. 2019 Feb 1;8(2):giy162. doi: 10.1093/gigascience/giy162. Gigascience. 2019. PMID: 30649288 Free PMC article.
-
Advances in plant chromosome genomics.Biotechnol Adv. 2014 Jan-Feb;32(1):122-36. doi: 10.1016/j.biotechadv.2013.12.011. Epub 2014 Jan 7. Biotechnol Adv. 2014. PMID: 24406816 Review.
-
Bridging the Gap between Vertebrate Cytogenetics and Genomics with Single-Chromosome Sequencing (ChromSeq).Genes (Basel). 2021 Jan 19;12(1):124. doi: 10.3390/genes12010124. Genes (Basel). 2021. PMID: 33478118 Free PMC article. Review.
Cited by
-
How to identify sex chromosomes and their turnover.Mol Ecol. 2019 Nov;28(21):4709-4724. doi: 10.1111/mec.15245. Epub 2019 Oct 10. Mol Ecol. 2019. PMID: 31538682 Free PMC article. Review.
-
Diversity, distribution, and significance of transposable elements in the genome of the only selfing hermaphroditic vertebrate Kryptolebias marmoratus.Sci Rep. 2017 Jan 10;7:40121. doi: 10.1038/srep40121. Sci Rep. 2017. PMID: 28071692 Free PMC article.
-
Comparative genomics reveals insights into avian genome evolution and adaptation.Science. 2014 Dec 12;346(6215):1311-20. doi: 10.1126/science.1251385. Epub 2014 Dec 11. Science. 2014. PMID: 25504712 Free PMC article.
-
Comparative mapping of the wild perennial Glycine latifolia and soybean (G. max) reveals extensive chromosome rearrangements in the genus Glycine.PLoS One. 2014 Jun 17;9(6):e99427. doi: 10.1371/journal.pone.0099427. eCollection 2014. PLoS One. 2014. PMID: 24937645 Free PMC article.
-
Chromosomer: a reference-based genome arrangement tool for producing draft chromosome sequences.Gigascience. 2016 Aug 22;5(1):38. doi: 10.1186/s13742-016-0141-6. Gigascience. 2016. PMID: 27549770 Free PMC article.
References
-
- Hardison RC. Conserved noncoding sequences are reliable guides to regulatory elements. Trends Genet. 2000;16(9):369–372. - PubMed
-
- Bejerano G, et al. Ultraconserved elements in the human genome. Science. 2004;304(5675):1321–1325. - PubMed
-
- Pollard KS, et al. An RNA gene expressed during cortical development evolved rapidly in humans. Nature. 2006;443(7108):167–172. - PubMed
-
- Murphy WJ, et al. Dynamics of mammalian chromosome evolution inferred from multispecies comparative maps. Science. 2005;309(5734):613–617. - PubMed
Publication types
MeSH terms
Grants and funding
LinkOut - more resources
Full Text Sources
Other Literature Sources
Molecular Biology Databases
