. 2013 Mar 1;19(5):1225-31.
doi: 10.1158/1078-0432.CCR-12-1630. Epub 2013 Jan 10.

BRAF inhibition is associated with enhanced melanoma antigen expression and a more favorable tumor microenvironment in patients with metastatic melanoma

Affiliations

BRAF inhibition is associated with enhanced melanoma antigen expression and a more favorable tumor microenvironment in patients with metastatic melanoma

Dennie T Frederick et al. Clin Cancer Res. .

Abstract

Purpose: To evaluate the effects of BRAF inhibition on the tumor microenvironment in patients with metastatic melanoma.

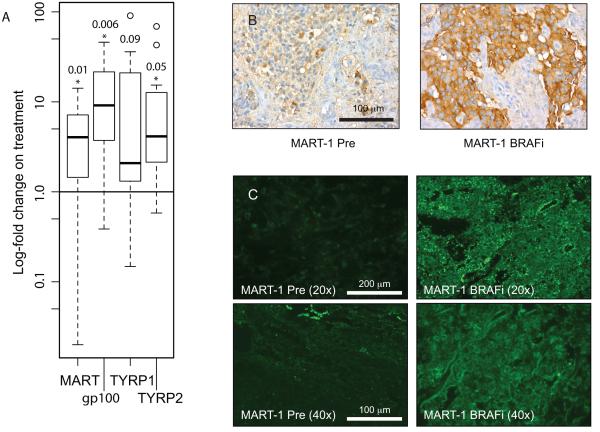
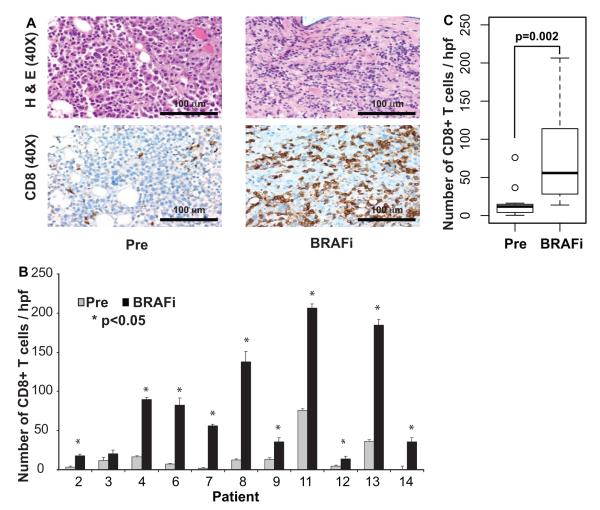
Experimental design: Thirty-five biopsies were collected from 16 patients with metastatic melanoma pretreatment (day 0) and at 10 to 14 days after initiation of treatment with either BRAF inhibitor alone (vemurafenib) or BRAF + MEK inhibition (dabrafenib + trametinib) and were also taken at time of progression. Biopsies were analyzed for melanoma antigens, T-cell markers, and immunomodulatory cytokines.

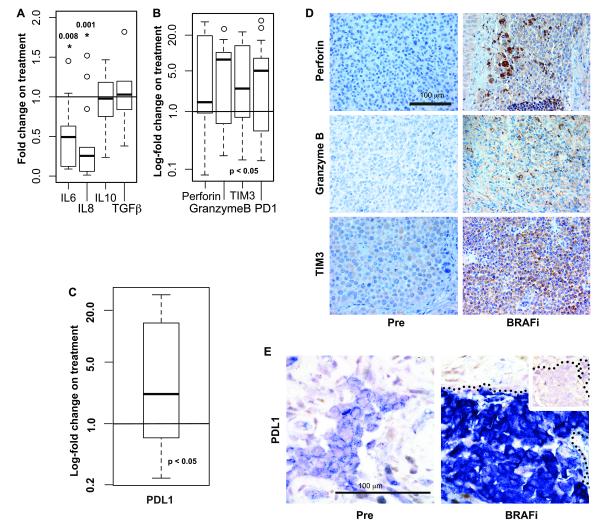
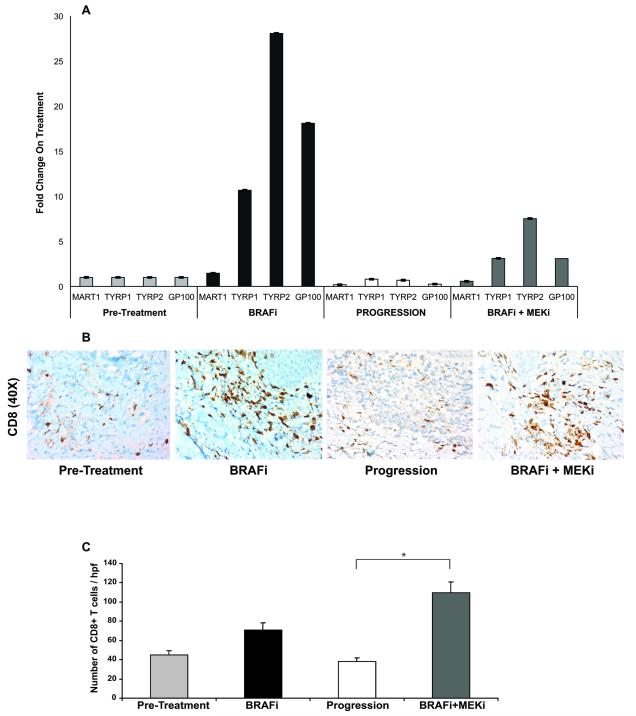
Results: Treatment with either BRAF inhibitor alone or BRAF + MEK inhibitor was associated with an increased expression of melanoma antigens and an increase in CD8+ T-cell infiltrate. This was also associated with a decrease in immunosuppressive cytokines [interleukin (IL)-6 and IL-8] and an increase in markers of T-cell cytotoxicity. Interestingly, expression of exhaustion markers TIM-3 and PD1 and the immunosuppressive ligand PDL1 was increased on treatment. A decrease in melanoma antigen expression and CD8 T-cell infiltrate was noted at time of progression on BRAF inhibitor alone and was reversed with combined BRAF and MEK inhibition.

Conclusions: Together, these data suggest that treatment with BRAF inhibition enhances melanoma antigen expression and facilitates T-cell cytotoxicity and a more favorable tumor microenvironment, providing support for potential synergy of BRAF-targeted therapy and immunotherapy. Interestingly, markers of T-cell exhaustion and the immunosuppressive ligand PDL1 are also increased with BRAF inhibition, further implying that immune checkpoint blockade may be critical in augmenting responses to BRAF-targeted therapy in patients with melanoma.


Figures

Figure 1
Figure 1. BRAF inhibition is associated with increased melanoma antigen expression in tumors of patients with metastatic melanoma
Tumors were harvested and mRNA levels of gp100, MART-1, TYRP-1, and TYRP-2 in patients with metastatic melanoma undergoing treatment with a selective inhibitor of BRAFV600E were assayed. (A) Expression levels of the respective MDAs are shown as fold increase over pre-treatment value and are plotted on a log scale in a box and whiskers plot (n=12). The bottom and top of the 25th and 75th percentile respectively for all patients, with the bar indicating the median value. The whiskers indicate the extremes with open circles represent data points greater than 1.5 times the interquartile range. (B) Immunohistochemistry (40× magnification) and (C) immunofluorescence staining for the melanoma antigen MART-1 in pre-treatment and on-treatment biopsies (patient 2) was performed to confirm that protein expression correlated with mRNA expression. All microscopy was repeated at least 3 times with representative examples shown. P-values are from a two-tailed student t-test with a mu of 1, which corresponds to no change in mRNA levels on treatment. (*) represents p ≤ 0.05.
Figure 2
Figure 2. BRAF inhibition is associated with increased CD8+ T cell infiltrate in tumors of patients with metastatic melanoma
Tumors biopsied pre-treatment and on-treatment were stained for H&E and IHC was performed for CD8+ T cells with a representative patient shown (A). CD8+ T cell counts were performed in a blinded fashion by a dedicated dermatopathologist (B). Average CD8+ T cells counts are plotted for each patient with error bars representing the standard deviation of four measurements. CD8+ counts from all patients (n=11) are expressed in a box and whiskers plot both pre and on treatment (C).
Figure 3
Figure 3. BRAF inhibition is associated with decreased immunosuppressive cytokines & markers of T cell cytotoxicity but increased T cell exhaustion markers and PDL1 in tumors of patients with metastatic melanoma
Tumors were harvested and mRNA levels of IL-6, IL-8, IL-10, and TGFβ (A), Perforin (n=11), GranzymeB (n=11), TIM3 (n=14) and PD1 (n=14) (B) and PDL1 (n=11) (C) in patients with metastatic melanoma undergoing treatment with a selective inhibitor of BRAFV600E were assayed. All patients are expressed in a box and whiskers plot. Open circles represent data points greater than 1.5 times the interquartile range. p-values indicated are from a two tailed student t-test with a mu of 1, which represents no change in mRNA value with respect to the pre-treatment value. (*) represents p ≤ 0.05. Immunohistochemistry (40× magnification) for the Perforin, Granzyme B and TIM3 (patient 6) (D) and PDL1 (Patient 12) (E) in pre-treatment and on-treatment biopsies was performed to confirm that protein expression correlated with mRNA expression. The dotted line=tumor-stroma interface and the inset is the isotype-specific control.
Figure 4
Figure 4. Melanoma antigen expression and CD8+ T cell infiltrate are decreased at time of progression and restored through MEK inhibition
Tumors were harvested at time of progression and at time of treatment with combined BRAF inhibition and MEK inhibition for patient 3. mRNA levels of the melanoma antigens gp100, MART-1, TYRP-1, and TYRP-2 were assayed (A). IHC was performed for CD8+ T cells on patient tumor samples (B). CD8+ T cells were identified and counted by a dedicated pathologist (C). Average CD8+ T cells counts are plotted with error bars representing the standard deviation of four measurements. (*) represents p ≤ 0.05.

References

    1. Jemal A, Siegel R, Ward E, Hao Y, Xu J, Thun MJ. Cancer statistics, 2009. CA Cancer J Clin. 2009;59:225–49. - PubMed
    1. Balch CM, Gershenwald JE, Soong SJ, Thompson JF, Atkins MB, Byrd DR, et al. Final version of 2009 AJCC melanoma staging and classification. J Clin Oncol. 2009;27:6199–206. - PMC - PubMed
    1. Sosman JA, Kim KB, Schuchter L, Gonzalez R, Pavlick AC, Weber JS, et al. Survival in BRAF V600-mutant advanced melanoma treated with vemurafenib. The New England journal of medicine. 2012;366:707–14. - PMC - PubMed
    1. Singh M, Lin J, Hocker TL, Tsao H. Genetics of melanoma tumorigenesis. Br J Dermatol. 2008;158:15–21. - PubMed
    1. Boni A, Cogdill AP, Dang P, Udayakumar D, Njauw CN, Sloss CM, et al. Selective BRAFV600E inhibition enhances T-cell recognition of melanoma without affecting lymphocyte function. Cancer research. 2010;70:5213–9. - PubMed

Publication types

MeSH terms