. 2013 Jan 1;27(1):24-38.
doi: 10.1101/gad.199190.112.

Tissue-specific control of brain-enriched miR-7 biogenesis

Affiliations

Tissue-specific control of brain-enriched miR-7 biogenesis

Nila Roy Choudhury et al. Genes Dev. .

Abstract

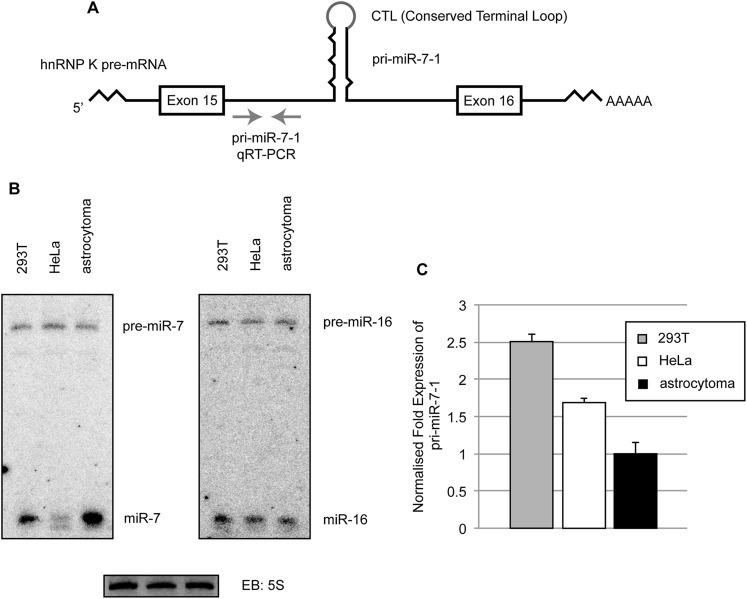
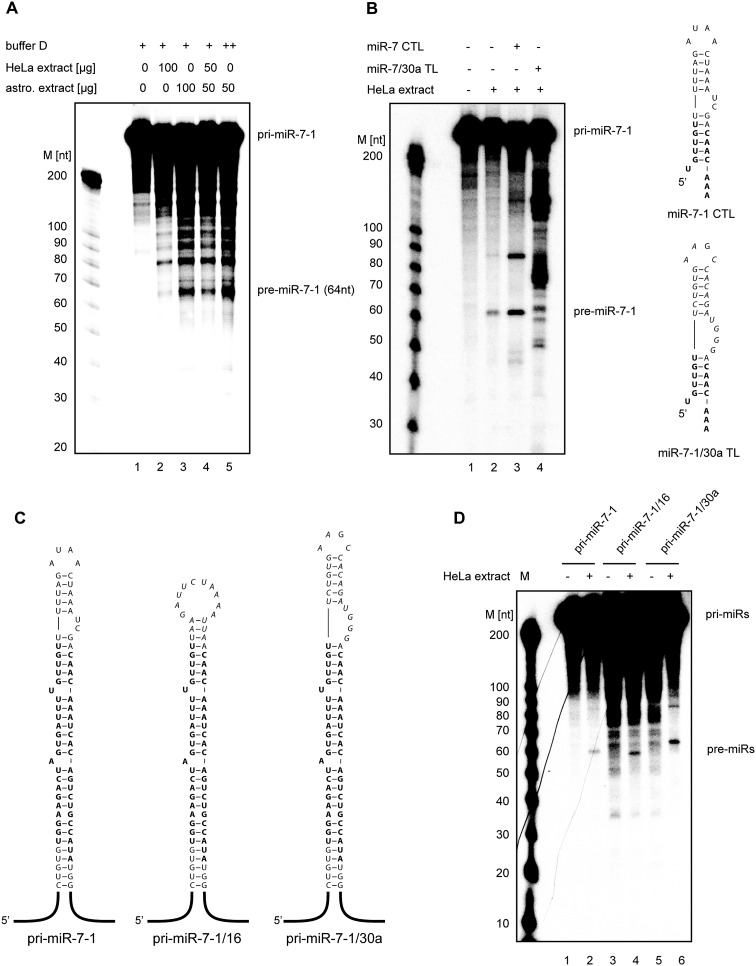
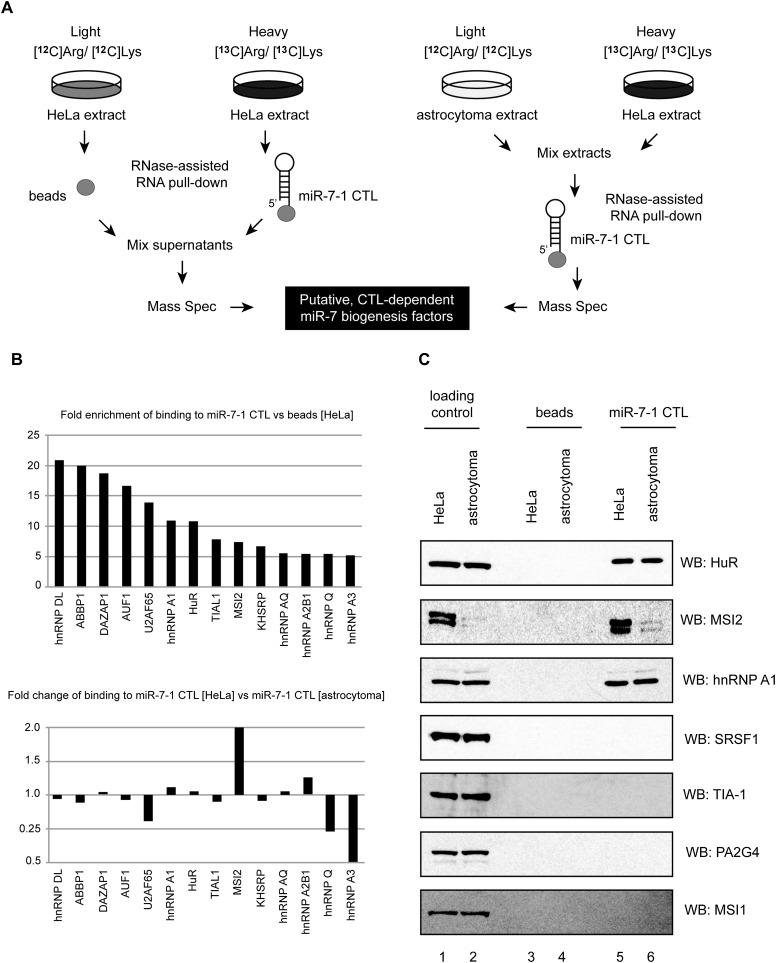
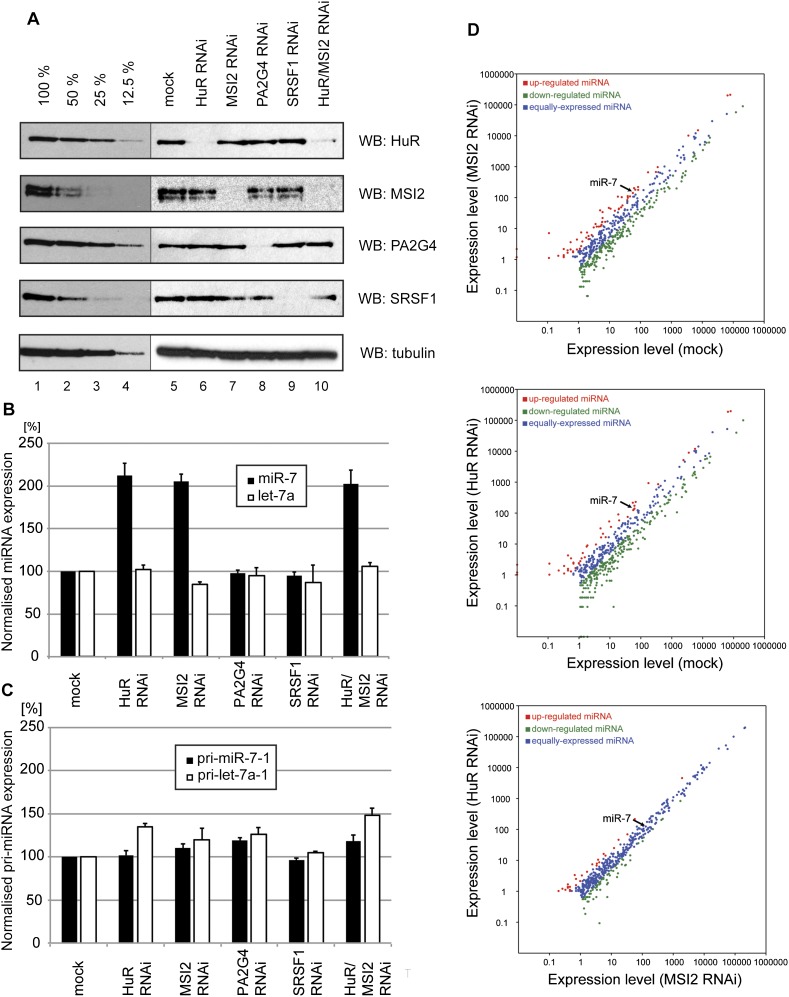
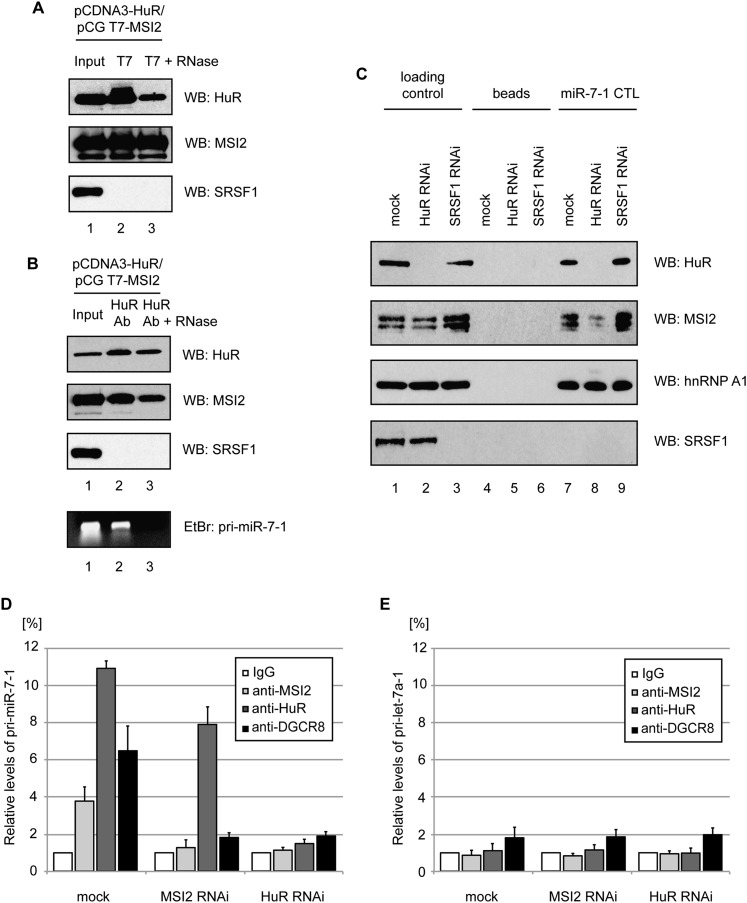
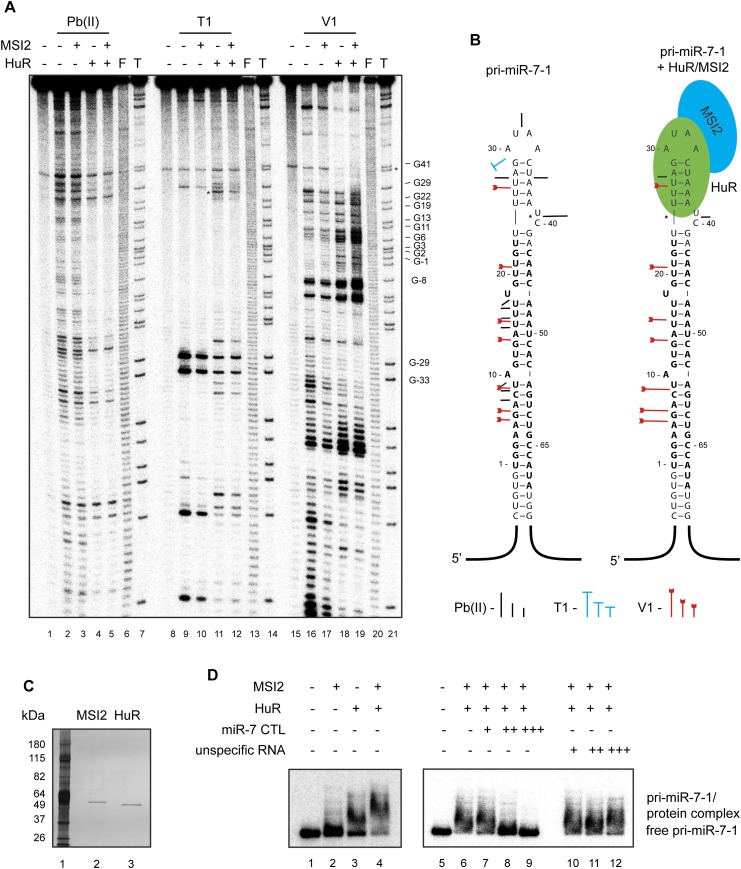
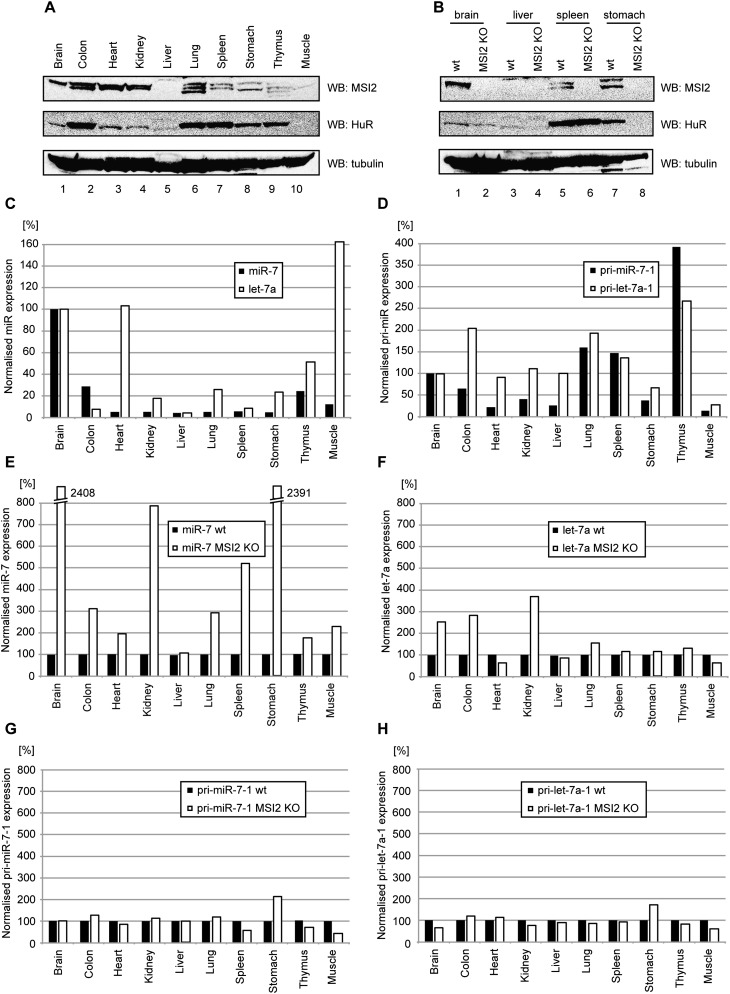
MicroRNA (miRNA) biogenesis is a highly regulated process in eukaryotic cells. Several mature miRNAs exhibit a tissue-specific pattern of expression without an apparent tissue-specific pattern for their corresponding primary transcripts. This discrepancy is suggestive of post-transcriptional regulation of miRNA abundance. Here, we demonstrate that the brain-enriched expression of miR-7, which is processed from the ubiquitous hnRNP K pre-mRNA transcript, is achieved by inhibition of its biogenesis in nonbrain cells in both human and mouse systems. Using stable isotope labeling by amino acids in cell culture (SILAC) mass spectrometry combined with RNase-assisted RNA pull-down, we identified Musashi homolog 2 (MSI2) and Hu antigen R (HuR) proteins as inhibitors of miR-7 processing in nonneural cells. This is achieved through HuR-mediated binding of MSI2 to the conserved terminal loop of pri-miR-7. Footprinting and electrophoretic gel mobility shift analysis (EMSA) provide further evidence for a direct interaction between pri-miR-7-1 and the HuR/MSI2 complex, resulting in stabilization of the pri-miR-7-1 structure. We also confirmed the physiological relevance of this inhibitory mechanism in a neuronal differentiation system using human SH-SY5Y cells. Finally, we show elevated levels of miR-7 in selected tissues from MSI2 knockout (KO) mice without apparent changes in the abundance of the pri-miR-7 transcript. Altogether, our data provide the first insight into the regulation of brain-enriched miRNA processing by defined tissue-specific factors.


Figures

Figure 1.
Figure 1.
The biogenesis of miR-7 is regulated post-transcriptionally. (A) Schematic of the segment of the hnRNP K pre-mRNA that harbors the pri-miR-7-1 stem–loop region in intron 15. The CTL of pri-miR-7-1 is indicated in gray. Arrows represent relative positions of qRT–PCR primers used to measure pri-miR-7-1 levels. (B) Northern blot analysis of total RNA from astrocytoma 1321N1, 293T, and HeLa cells shows high, medium, and low levels of miR-7, respectively. In contrast, miR-16 shows similar abundance in the three cell lines. As a loading control, ethidium bromide staining of 5S rRNA is shown. (C) Real-time qRT–PCR on total RNA from 293T (gray bar), HeLa (white bar), and astrocytoma 1321N1 (black bar) cells shows high, medium, and low levels of pri-mR-7-1, respectively. The values were normalized to GAPDH mRNA levels. The fold change was plotted relative to values derived from astrocytoma cells, which were set to 1. Mean values and standard deviations (SD) of three independent qRT–PCRs are shown.
Figure 2.
Figure 2.
Processing of pri-miR-7-1 is inhibited by nonneural CTL-binding factors. (A) In vitro processing of pri-miR-7-1 in HeLa and astrocytoma 1321N1 cell extracts. Radiolabeled primary miR-7-1 transcripts (50 × 103 cpm [counts per minute], ∼20 pmol, 665 nM) were incubated in the presence of 50% (w/v) total HeLa extract (lane 2), 50% (w/v) astrocytoma 1321N1 extract (lane 3), 25% (w/v) HeLa extract plus 25% (w/v) astrocytoma 1321N1 extract (lane 4), or 25% (w/v) astrocytoma 1321N1 extract (lane 5). Lane 1 shows the negative control with no extract added. Products were analyzed on an 8% polyacrylamide gel. (M) RNA size marker. (B) In vitro processing of pri-miR-7-1 is derepressed in the presence of unlabeled truncated wild-type pri-miR-7-1. pri-miR-7-1 was incubated with HeLa extracts (lane 2) with 1 nmol of miR-7-1 CTL (lane 3) or 1 nmol of pri-miR-7-1/30a CTL (lane 4). Lane 1 shows the negative control with no extract added. Analysis was performed as described in A. Schematic of the RNA secondary structure of the wild-type miR-7-1 CTL and mutant miR-7-1/30a TL is shown on the right. (C) Predicted secondary structures of wild-type pri-miR-7-1 and CTL mutants. The wild-type terminal loop sequence was replaced with the pri-miR-16 or pri-miR-30a TLs, resulting in pri-miR-7-1/16 and pri-miR-7-1/30a hybrids, respectively. (D) The processing of pri-miR-7-1 is inhibited by sequences present in its terminal loop. Radiolabeled pri-miR-7-1 (lane 2), pri-miR-7-1/16 (lane 4), and pri-miR-7-1/30a (lane 6) transcripts (50 × 103 cpm, 20 pmol, 665 nM) were incubated in the presence of 50% (w/v) total HeLa extract. Lanes 1, 3, and 5 show negative controls with no extract added. Products were analyzed on an 8% polyacrylamide gel. (M) RNA size marker.
Figure 3.
Figure 3.
SILAC combined with RNase-assisted RNA pull-down reveals putative miR-7 biogenesis factors. (A) Schematic of the method. The left panel shows the strategy used to distinguish background noise that arises from proteins binding to the agarose beads compared with proteins that specifically bind to the miR-7-1 CTL RNA. HeLa cells were grown in “light” medium containing 12C6-arginine and 12C6-lysine or in “heavy” medium containing 13C6-arginine and 13C6-lysine. Next, RNase-assisted RNA pull-down was performed on either agarose beads incubated with extracts from “light” HeLa cells or beads with a covalently linked miR-7-1 CTL incubated with extracts from “heavy” HeLa cells. After RNase treatment, the resulting supernatants were mixed and subjected to quantitative mass spectrometry. The right panel represents a way of identifying protein factors in the extracts from different cells or experimental conditions that differentially bind to the bait RNA. The workflow is similar to the one described above, with different extracts, premixed and incubated with the same complexes of agarose beads with a covalently linked miR-7-1 CTL. Finally, quantitative mass spectrometry identified RNA-binding proteins that, in the case of miR-7-1 CTL, are putative miR-7 biogenesis factors. (B) The top graph represents the fold enrichment of proteins that bind to the miR-7-1 CTL compared with the beads alone in experiments with “light” and “heavy” HeLa cell extracts. The fold enrichment cutoff was set to 5. The bottom graph represents the fold enrichment of proteins that bind to the miR-7-1 CTL in experiments with “heavy” HeLa cell extracts compared with “light” astrocytoma cell extracts. (C) Western blot analysis of miR-7-1 CTL RNA pull-down with HeLa and astrocytoma cell extracts on select proteins identified in B (HuR, MSI2, and hnRNP A1) and control proteins (SRSF1, TIA-1, PA2G4, and MSI1). Lanes 1 and 2 represent 100 μg of loading control of HeLa and astrocytoma cell extracts, respectively. Lanes 3 and 4 show reactions with beads alone. Lanes 5 and 6 represent miR-7-1 CTL RNA pull-down with HeLa and astrocytoma cells extracts, respectively.
Figure 4.
Figure 4.
MSI2 and HuR regulate miR-7 biogenesis in vivo through converging pathways. (A) Western blot analysis of protein extracts from HeLa cells depleted of HuR (lane 6), MSI2 (lane 7), PA2G4 (lane 8), SRSF1 (lane 9), or both HuR and MSI2 (lane 10) using RNAi. Lanes 1–4 show serial dilutions of total protein extracts, providing estimation of the Western blot assay linearity and the limit of detection. Lane 5 shows a mock-transfected control. Lanes 6–10 show Western blot results. (B) Real-time qRT–PCR of miRNAs from HeLa cells depleted of HuR, MSI2, PA2G4, SRSF1, and HuR/MSI2 reveals a substantial increase in the levels of miR-7 (black bars) upon HuR depletion, MSI2 depletion, or combined HuR/MSI2 depletion. These values were normalized to miR-16 levels. The fold change in the corresponding miRNA abundance mediated by RNAi was plotted relative to values from a mock-transfected control, which were set to 100. Mean values and SDs of three independent experiments are shown. No significant changes in the levels of let-7a were observed in any case. (C) Real-time qRT–PCR on pri-miRNAs from cells depleted as in B shows a lack of substantial change in the relative levels of the corresponding pri-miR-7-1 (black bars) and pri-let-7a-1 (white bars) transcripts. The values were normalized to GAPDH levels. The fold change in the corresponding pri-miRNA abundance mediated by RNAi was plotted relative to values from a mock-transfected control, which were set to 100. (D) Small RNA-seq analysis of MSI2 and HuR knockdown. The top graph shows a comparison of mock-treated HeLa cells and MSI2-depleted cells (MS2 RNAi), and the middle graph shows a comparison of mock-treated HeLa cell and HuR-depleted cells, whereas the bottom panel shows a comparison between MSI2-depleted cells and HuR-depleted cells. mir-7 is indicated with an arrow. Library construction, sequencing, and data analysis were performed by BGI (Beijing Genomics Institute).
Figure 5.
Figure 5.
HuR recruits MSI2 to the pri-miR-7-1 CTL through a direct interaction. (A) Extracts prepared from HeLa cells transfected with pCG T7-MSI2 and pCDNA3-HuR were incubated with T7 agarose. (Lane 2) The bound proteins were separated on a 10% SDS–polyacrylamide gel and analyzed by Western blotting with anti-HuR, anti-MSI2, or anti-SRSF1 antibodies. (Lane 3) Alternatively, the immunoprecipitate was treated with RNases A/T1 prior to loading on the gel. Lane 1 was loaded with 2% of the amount of extract used for each immunoprecipitation. (B) Extracts prepared from HeLa cells transfected with pCG T7-MSI2 and pCDNA3-HuR were incubated with protein A beads and anti-HuR antibody. (Lane 2) The bound proteins were separated on a 10% SDS–polyacrylamide gel and analyzed by Western blotting with anti-HuR, anti-MSI2, or anti-SRSF1 antibodies. (Lane 3) Alternatively, the immunoprecipitate was treated with RNases A/T1 prior to loading on the gel. Lane 1 was loaded with 2% of the amount of extract used for each immunoprecipitation. Ethidium bromide-stained 1% agarose gel of RT–PCR assay detecting pri-miR-7-1 in input; anti-HuR immunoprecipitation and anti-HuR immunoprecipitation with RNase treatment are shown in lanes 13, respectively. (C) Western blot analysis of miR-7-1 CTL RNA pull-down in mock-, HuR- or SRSF1-depleted HeLa cell extracts for HuR, MSI2, hnRNP A1, and SRSF1. Lanes 13 show loading control of HeLa cell extracts from mock, HuR RNAi, and SRSF1 RNAi, respectively. Lanes 46 show reactions with beads only. Lanes 79 represent miR-7-1 CTL RNA pull-down in HeLa cell extracts from mock, HuR RNAi, and SRSF1 RNAi, respectively. (D,E) RNA immunoprecipitation assays of formaldehyde cross-linked HeLa cells using anti-MSI2, anti-HuR, and anti-DGCR8 antibodies, coupled with protein-A agarose beads. qRT–PCR analysis was performed on TRIzol LS-isolated RNA with primers detecting pri-miR-7-1 (D) and pri-let-7a-1 (E) transcripts. The percentage of immunoprecipitation was plotted relative to values derived from IgG controls, which were set to 1. Mean values and SDs of three independent experiments are shown.
Figure 6.
Figure 6.
Recombinant HuR binds directly to the pri-miR-7-1 CTL and recruits MSI2, increasing the rigidity of the stem–loop structure. (A) Structure probing and footprint analysis of the pri-miR-7-1 in complex with HuR and/or MSI2 proteins. Cleavage patterns were obtained for 5′ 32P-labeled pri-miR-7-1 transcript (100 × 103 cpm, ∼40 pmol, 4 μM) incubated in the absence (lanes 1,2,8,9,15,16) or presence of recombinant MSI2 (200 ng, 500 nM) (lanes 3,10,17), HuR (200 ng, 500 nM) (lanes 4,11,18), and both proteins (200 ng, 500 nM) (lanes 5,12,19) treated with Pb (II) lead ions (0.5 mM), ribonuclease T1 (1.5 U/μL), and ribonuclease V1 (0.025 U/mL). F (lanes 6,13,20) and T (lanes 7,14,21) denote nucleotide residues subjected to partial digestion with formamide (every nucleotide) or ribonuclease T1 (G-specific cleavage), respectively. Electrophoresis was performed in a 6% polyacrylamide gel under denaturing conditions. The positions of selected G residues are indicated. Nucleotides are numbered from the 5′ site of Drosha cleavage. (B) Proposed structure of free and HuR/MSI2-bound pri-miR-7-1 (additionally supported by the RNA pull-down results presented in Fig. 3; Supplemental Fig. 3). The sites and intensities of cleavages generated by structure probes (presented below) within the pre-miR-7-1 region are shown. The asterisk indicates selected intrinsic or protein-induced in-line autocatalytic RNA cleavages. (C) Silver-stained 4%–12% Novex Tri-Bis SDS-PAGE of recombinant MSI2 (100 ng) (lane 2) and recombinant HuR (100 ng) (lane 3) shows the quality of the proteins (OriGene Technologies). (Lane 1) BenchMark prestained protein ladder indicates approximate molecular weights. The proteins migrate similarly to corresponding endogenous proteins detected by relevant antibodies. (D) EMSA of pri-miR-7-1 with the MSI2 and HuR proteins. Electrophoresis was performed in a 5% polyacrylamide gel under native conditions. Prior to electrophoresis, 5′ 32P-labeled pri-miR-7-1 transcript (50 × 103 cpm, ∼20 pmol, 2 μM) was incubated without proteins (lane 1) or in the presence of recombinant MSI2 (200 ng, 500 nM) (lane 2), HuR (200 ng, 500 nM) (lane 3), or both proteins (200 ng, 500 nM) (lane 4). miR-7-1 and unspecific indicate unlabeled RNA competitors; (+) 5 pmol; (++) 50 pmol; (+++) 500 pmol.
Figure 7.
Figure 7.
Brain-enriched miR-7 is up-regulated in a MSI2 KO mouse. (A) Western blot analysis of protein extracts from wild-type mouse tissues using anti-MSI2, anti-HuR, and anti-tubulin. (Lane 1) Brain. (Lane 2) Colon. (Lane 3) Heart. (Lane 4) Kidney. (Lane 5) Liver. (Lane 6) Lung. (Lane 7) Spleen. (Lane 8) Stomach. (Lane 9) Thymus. (Lane 10) Muscle. (B) Western blot analysis of protein extracts from selected MSI2 KO mouse tissues. Lanes 1, 3, 5, and 7 indicate extracts from a wild-type mouse, whereas lanes 2, 4, 6, and 8 show proteins derived from a MSI2 KO mouse. (C) Real-time qRT–PCR on miRNAs from 1 μg of total RNA from select wild-type mouse tissues reveals a substantial enrichment of miR-7 (black bars) in brain tissue and a different pattern of let-7a (white bars) in select tissues. The values were normalized to 5S levels. The fold change of miR abundance was plotted relative to the values from brain total RNA, which were set to 100. (D) Real-time qRT–PCR on pri-miRNAs from samples as shown in A show a lack of significant correlation with the abundance of the corresponding mature miRNAs (correlation coefficient = 0.16, P-value = 0.33). Values were normalized to GAPDH levels. The fold change of pri-miRNA abundance was plotted relative to the values from brain total RNA, which were set to 100. (E) Real-time qRT–PCR on miR-7 from total RNA samples derived from wild-type (black bars) and MSI2 KO (white bars) mice show a large increase in the levels of miR-7 in MSI2 KO tissues. Values were normalized to 5S levels. The fold change of miR-7 abundance was plotted relative to values derived from the wild-type mouse, which were set to 100. (F) Real-time qRT–PCR on let-7a from total RNA samples derived from wild-type (black bars) and MSI2 KO (white bars) mice. Data are presented as in E. (G,H) Real-time qRT–PCR on pri-miR-7-1 and pri-let-7a-1 from samples as shown in E show very little difference between the wild-type and MSI2 KO mice. Values were normalized to GAPDH levels. The fold change of pri-miR abundance was plotted relative to the values from the wild-type mouse, which were set to 100.

Similar articles

Cited by

References

    1. Barbouti A, Hoglund M, Johansson B, Lassen C, Nilsson PG, Hagemeijer A, Mitelman F, Fioretos T 2003. A novel gene, MSI2, encoding a putative RNA-binding protein is recurrently rearranged at disease progression of chronic myeloid leukemia and forms a fusion gene with HOXA9 as a result of the cryptic t(7;17)(p15;q23). Cancer Res 63: 1202–1206 - PubMed
    1. Bushati N, Cohen SM 2007. MicroRNA functions. Annu Rev Cell Dev Biol 23: 175–205 - PubMed
    1. Caceres JF, Misteli T, Screaton GR, Spector DL, Krainer AR 1997. Role of the modular domains of SR proteins in subnuclear localization and alternative splicing specificity. J Cell Biol 138: 225–238 - PMC - PubMed
    1. Davis BN, Hata A 2010. MicroRNA in cancer—the involvement of aberrant microRNA biogenesis regulatory pathways. Genes Cancer 1: 1100–1114 - PMC - PubMed
    1. de Andres-Aguayo L, Varas F, Kallin EM, Infante JF, Wurst W, Floss T, Graf T 2011. Musashi 2 is a regulator of the HSC compartment identified by a retroviral insertion screen and knockout mice. Blood 118: 554–564 - PubMed

Publication types