. 2013 Jan 1;27(1):98-115.
doi: 10.1101/gad.205278.112.

Mouse TU tagging: a chemical/genetic intersectional method for purifying cell type-specific nascent RNA

Affiliations

Mouse TU tagging: a chemical/genetic intersectional method for purifying cell type-specific nascent RNA

Leslie Gay et al. Genes Dev. .

Erratum in

  • Genes Dev. 2014 Dec 1;28(23):2677

Abstract

Transcriptional profiling is a powerful approach for understanding development and disease. Current cell type-specific RNA purification methods have limitations, including cell dissociation trauma or inability to identify all RNA species. Here, we describe "mouse thiouracil (TU) tagging," a genetic and chemical intersectional method for covalent labeling and purification of cell type-specific RNA in vivo. Cre-induced expression of uracil phosphoribosyltransferase (UPRT) provides spatial specificity; injection of 4-thiouracil (4TU) provides temporal specificity. Only UPRT(+) cells exposed to 4TU produce thio-RNA, which is then purified for RNA sequencing (RNA-seq). This method can purify transcripts from spatially complex and rare (<5%) cells, such as Tie2:Cre(+) brain endothelia/microglia (76% validated by expression pattern), or temporally dynamic transcripts, such as those acutely induced by lipopolysaccharide (LPS) injection. Moreover, generating chimeric mice via UPRT(+) bone marrow transplants identifies immune versus niche spleen RNA. TU tagging provides a novel method for identifying actively transcribed genes in specific cells at specific times within intact mice.


Figures

Figure 1.
Figure 1.
The mouse TU tagging method. (A) Schematic of the TU tagging method. Spatial control was provided by cell type-specific expression of UPRT (red), and temporal control was achieved by a pulse of 4TU (blue). Only UPRT+ cells exposed to 4TU will generate thio-labeled newly transcribed RNA, which then can be purified from the intact tissue or organism. (B,C) Schematic of the UPRT transgenes used in this study. (D) Schematic of TU tagging of endothelial RNA within the intact brain. (Green dot) 4TU; (B) biotin.
Figure 2.
Figure 2.
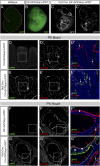
The CA>GFPstop>UPRT transgene was ubiquitously expressed and provided high-efficiency Cre-dependent UPRT expression. (A–C) E12.5 expression patterns. (A) The wild-type embryo has only minimal background autofluorescence. (B) The CA>GFPstop>UPRT single-transgenic embryo has uniform GFP expression. (C,C′) The antibody-stained section of a Tie2:Cre; CA>GFPstop>UPRT double-transgenic E12.5 embryo shows persistent GFP expression where Tie2:Cre is not expressed and UPRT expression in the characteristic Tie2:Cre endothelial pattern. UPRT expression was detected by anti-HA antibody staining of the HA:UPRT fusion protein. (D–E″) P6 brain (cerebellum) staining patterns. (D–D″) CA>GFPstop>UPRT single-transgenic shows no UPRT expression. (E–E″) Tie2:Cre; CA>GFPstop>UPRT double-transgenic shows robust UPRT expression in the PECAM1+ endothelial cells. White arrows indicate endothelial cells. (F–G″) P6 heart (aortic valve region) staining patterns. (F–F″) CA>GFPstop>UPRT single-transgenic shows no UPRT expression. (G–G″) Tie2:Cre; CA>GFPstop>UPRT double-transgenic shows robust UPRT expression in PECAM1+ endothelial and endocardial cells and a subset of aortic valve interstitial cells. White arrows indicate endothelial cells, red arrows show aortic valve endocardial cells, and white arrowheads mark aortic valve interstitial cells. Scale: box dimensions, 300 μm.
Figure 3.
Figure 3.
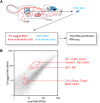
TU tagging of Tie2:Cre+ endothelial cells within the P6 brain. (A) Schematic of the experiment. Tie2:Cre; CA>GFPstop>UPRT double-transgenic P6 mice were given a 4TU injection subcutaneously and killed after 4 h, and the whole brain was removed. The brain total RNA was isolated (“total RNA”; blue) and a subset was used to purify thio-labeled presumptive endothelial RNA (“TU-tagged RNA”; red) for RNA-seq. (B) TU tagging of brain endothelial cells identified known endothelial and vascular genes. RNA-seq analysis of TU-tagged RNA versus total RNA; the average RPM from two biological replicates are shown for each gene. Note that 11 of the 13 pan-endothelial control genes have clear enrichment of their transcripts in the TU-tagged RNA based on their position at the left edge of the plot (Flt1, Tek, Kdr, Ets1, Cdh5, Pecam1, Emcn, Esam, Egfl7, Nos3, and Thsd1); two are not strongly enriched (Cd34 and Tie1). Some of the most depleted transcripts are shown with blue diamonds and include the neuronal transcripts Tubb2, ApoE, Nefl, Camkv, Pcp4, and Calb2 and the hemoglobin Hba-a1 transcript. (C) TU tagging of brain endothelial cells identified known endothelial and vascular genes and depleted for known neuronal genes. GO analysis of the most up-regulated genes (red; genes enriched equal to or greater than our 11 most enriched positive control genes were used for GO analysis) (Supplemental Table S1) and the 500 most down-regulated genes (blue) (Supplemental Table S1). Redundant categories were excluded. (D) TU tagging of brain endothelial cells identified genes expressed in the Tie2:Cre-derived endothelial and microglial/macrophage cells. Gene expression data at E14.5 (Eurexpress, used with permission) are shown for some of the 130 most up-regulated genes from TU tagging in Tie2:Cre; CA>GFPstop>UPRT double-transgenic whole-brain tissue. The top left pair are two of the pan-endothelial control genes (Ets1 and Esam).
Figure 4.
Figure 4.
TU tagging of Tie2:Cre+ endothelial cells within the P6 heart. (A) Schematic of the experiment (see Fig. 3 for explanation). (B) TU tagging of heart endothelial cells identified known endothelial-expressed genes. RNA-seq analysis of TU-tagged RNA versus total RNA; average RPM from two biological replicates are shown for each gene. Positive control genes are shown with red diamonds; note that nine of the 13 pan-endothelial control genes have clear enrichment in the TU-tagged RNA based on their position at the left edge of the plot (Flt1, Tek, Kdr, Ets1, Emcn, Esam, Egfl7, Nos3, and Thsd1), two others are almost as enriched (Pecam1 and Cdh5), and two are weakly enriched (Cd34 and Tie1). Some of the most depleted transcripts are shown with blue diamonds and include the cardiac muscle transcripts Tnni3, Tnnc1, Ckm, Cpt1b, Myl4, S100a1, and Kcne1 and the hemoglobin Hba-a1 transcript. (C) TU tagging of heart Tie2:Cre lineage-derived cells identified genes expressed in endothelium, endocardium, and valve (endocardial cushion) mesenchyme. Gene expression data at E14.5 (Eurexpress, used with permission) are shown for some of the 119 most up-regulated genes from TU tagging in Tie2:Cre; CA>GFPstop>UPRT double-transgenic whole heart tissue. The top row shows pan-endothelial control transcripts (Ets1 and Esam). (Arrow) Ventricle endocardial cells; (arrowhead) coronary endothelial cells; (black asterisk) Tie2:Cre-derived atrioventricular canal cushion mesenchyme.
Figure 5.
Figure 5.
TU tagging of Tie2:Cre+ embryonic brain endothelial cells. (A) Schematic of the experiment (see Fig. 3 for explanation). (B) TU tagging of E15.5 brain endothelial cells identified known endothelial and vascular genes. RNA-seq analysis of TU-tagged RNA versus total RNA; an average of two replicates for each gene. Six of the 13 pan-endothelial control genes cluster at the left edge of the plot (red oval: Flt1, Tek, Cdh5, Pecam1, Emcn, and Cd34), two are adjacent but less enriched (Kdr and Ets1), and five cluster closer to the center of the plot (red circle: Thsd1, Esam, Nos3, Tie1, and Egfl7).
Figure 6.
Figure 6.
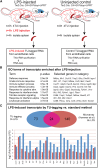
TU tagging of LPS-induced transcripts in the Tie2:Cre+ adult spleen. (A) Schematic of the experiment. TU-tagged RNA was purified from the intact spleen of LPS-induced mice (left) or uninduced control mice (right). (B) GO analysis of overrepresented categories found in the TU-tagged spleen transcripts determined to be significantly up-regulated upon LPS treatment. Selected GO terms shared by those genes were ranked by significance. A subset of LPS-induced spleen genes in each category is noted. (C) TU tagging of LPS-induced adult spleen transcripts identified known LPS-induced genes. The Venn diagram compares the set of significantly up-regulated TU-tagged transcripts following a 3-h LPS treatment with those identified in a published microarray study of the mouse spleen transcriptome response to a 6-h LPS exposure (fourfold up and higher). See the text for details. The bar graph shows the fold increase (log2 scale) of the 24 transcripts shared in common between the two data sets in their respective LPS induction studies. The colors match the experiments shown in the Venn diagram.
Figure 7.
Figure 7.
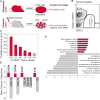
TU tagging of transplanted bone marrow cells in an unlabeled host. (A) Schematic of experiments comparing gene expression in whole spleen (ubiquitous UPRT) to gene expression in spleen leukocytes (chimeric UPRT). (Red) UPRT+ cells. (B) FACS quantification of UPRT+ leukocytes in the spleen of a chimeric mouse. Bone marrow donor mice express the CD45.2 allele on leukocytes, while the host leukocytes express the CD45.1 allele. Percentages are based on total cell counts in the spleen (excluding erythrocytes). The remaining 31.8% of cells in this spleen are the CD45-negative niche cells. These data produced the bar labeled “61” in C. (C) TU-tagged RNA yields as a function of UPRT+ cell frequency. FACS analysis was used to quantify UPRT+ CD45.2 cells following injection of decreasing amounts of UPRT+ donor bone marrow in multiple transplantation experiments. Representative yields are shown. One-hundred percent of UPRT is from a ubiquitous UPRT mouse (no bone marrow transplant) and 0.0% of UPRT is from a wild-type mouse (no bone marrow transplant). (D) Relative abundance of transcripts encoding leukocyte-specific cell surface receptors and the cognate niche-specific ligands. Receptor–ligand pairs are adjacent. The CCR7 receptor has three ligands: CCL19, CCL21a, and CCL21b. The chimeric/ubiquitous ratio is the RPM value for chimeric spleen TU-tagged RNA divided by RPM value for ubiquitous spleen RNA (negative values are inverse of the ratio). (E) GO categories of genes that are enriched in the chimeric spleen/ubiquitous spleen >1.33-fold (red bars) and genes that are depleted in the chimeric spleen/ubiquitous spleen less than twofold (gray bars). Representative enriched categories with statistically significant differences (P < 0.0001) are shown. Redundant categories are excluded.

Similar articles

Cited by

References

    1. Anders S, Huber W 2010. Differential expression analysis for sequence count data. Genome Biol 11: R106. - PMC - PubMed
    1. Balda MS, Matter K 2009. Tight junctions and the regulation of gene expression. Biochim Biophys Acta 1788: 761–767 - PubMed
    1. Bartfai T, Buckley PT, Eberwine J 2012. Drug targets: Single-cell transcriptomics hastens unbiased discovery. Trends Pharmacol Sci 33: 9–16 - PMC - PubMed
    1. Benicky J, Sanchez-Lemus E, Pavel J, Saavedra JM 2009. Anti-inflammatory effects of angiotensin receptor blockers in the brain and the periphery. Cell Mol Neurobiol 29: 781–792 - PMC - PubMed
    1. Brar GA, Yassour M, Friedman N, Regev A, Ingolia NT, Weissman JS 2012. High-resolution view of the yeast meiotic program revealed by ribosome profiling. Science 335: 552–557 - PMC - PubMed

Publication types