

Locomotor adaptation to a soleus EMG-controlled antagonistic exoskeleton
- PMID: 23307949
- PMCID: PMC3628010
- DOI: 10.1152/jn.01128.2011
Locomotor adaptation to a soleus EMG-controlled antagonistic exoskeleton
Abstract
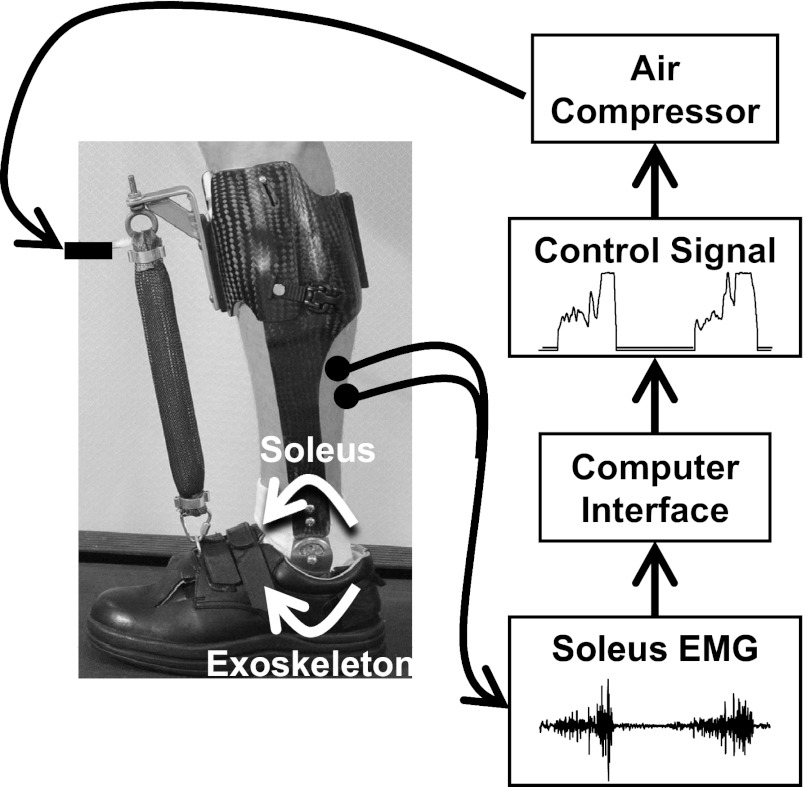
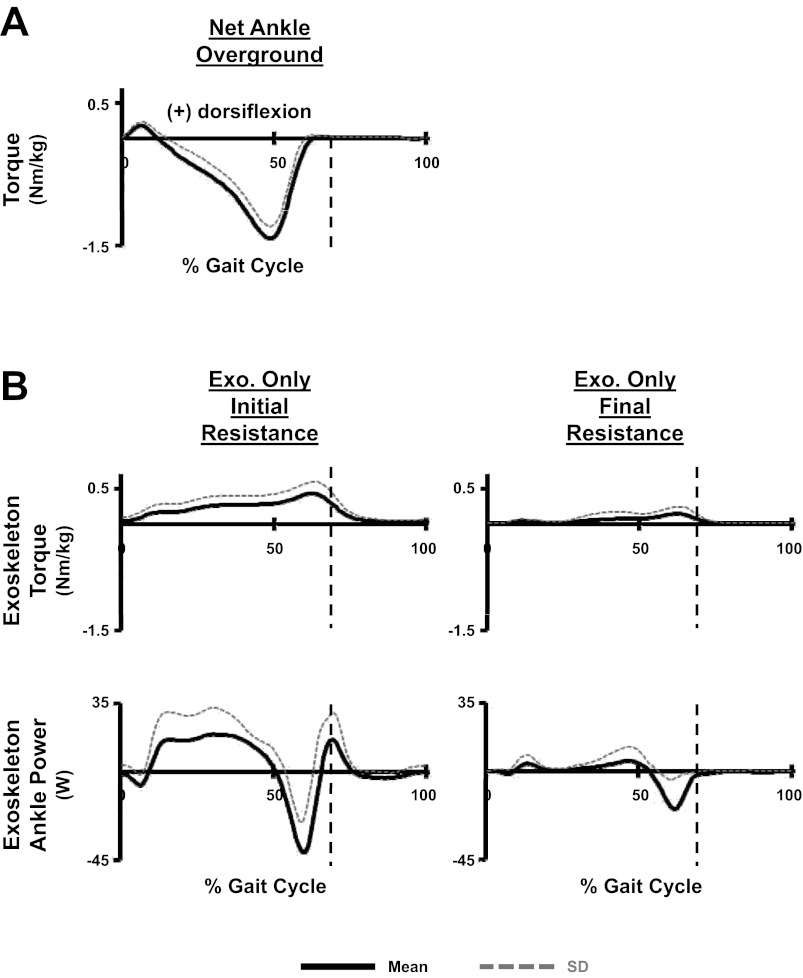
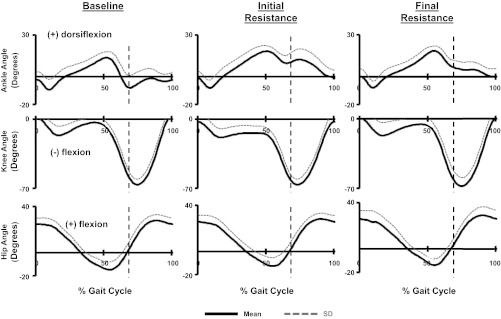
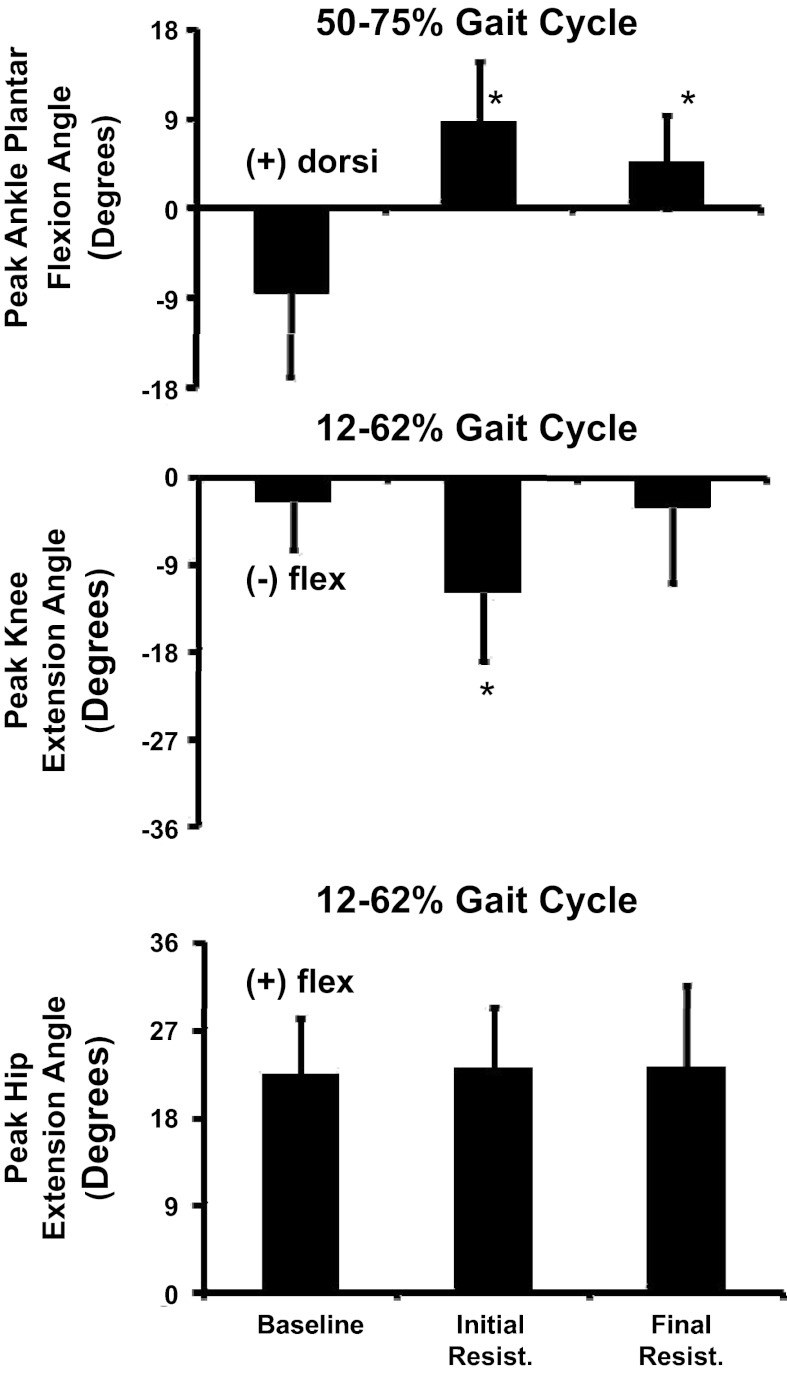
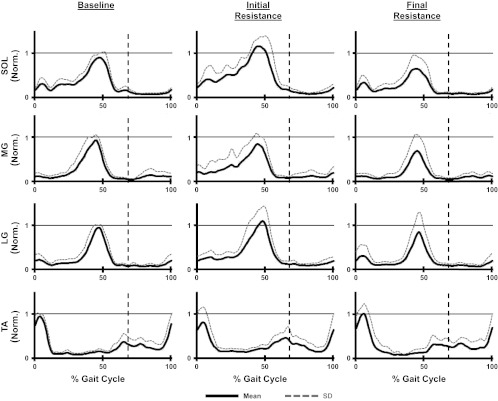
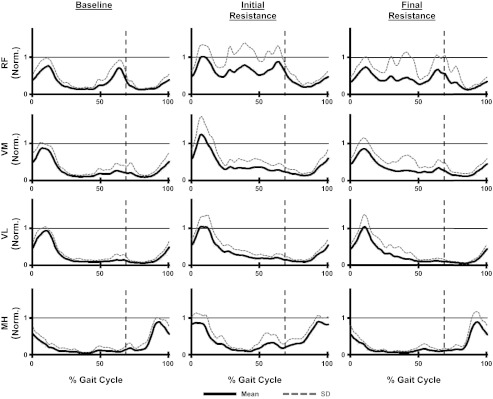
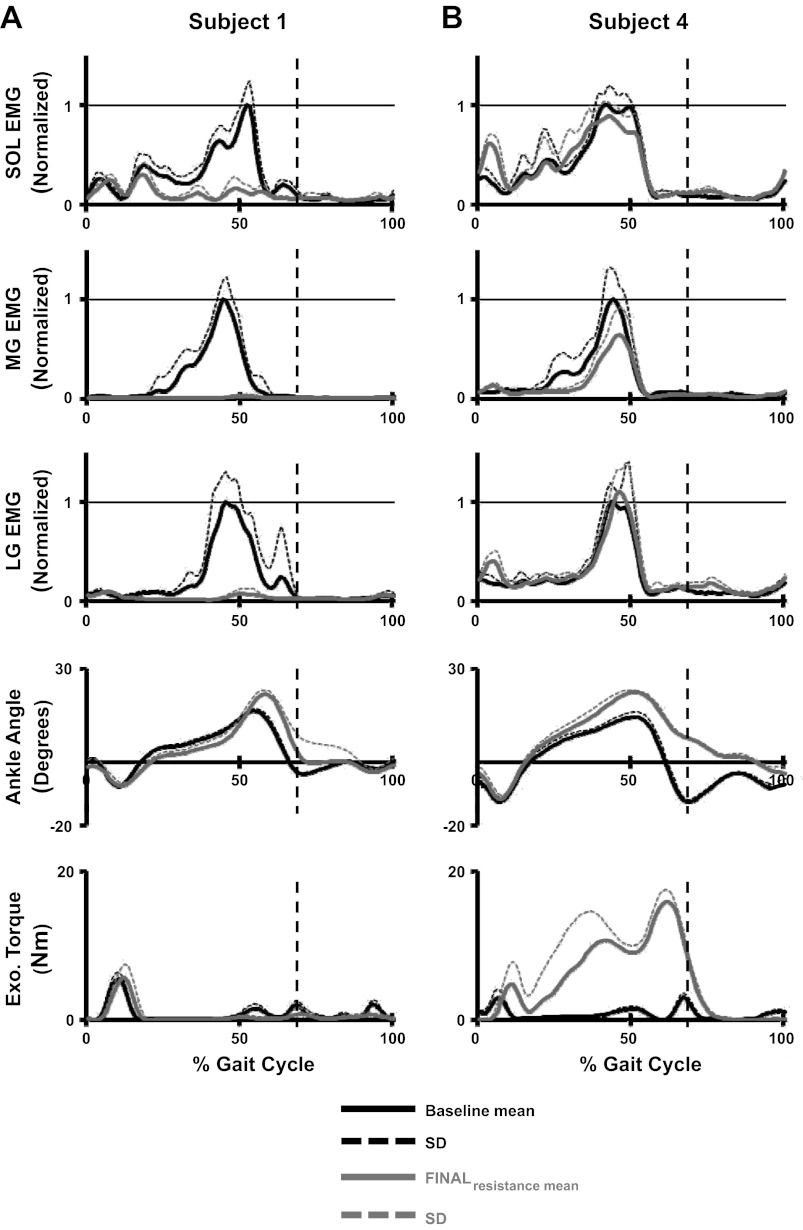
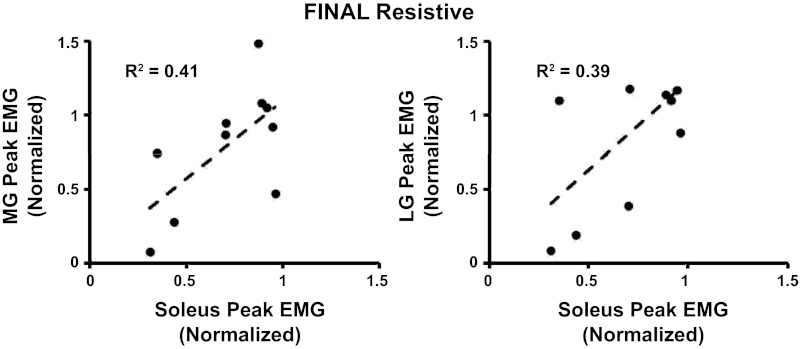
Locomotor adaptation in humans is not well understood. To provide insight into the neural reorganization that occurs following a significant disruption to one's learned neuromuscular map relating a given motor command to its resulting muscular action, we tied the mechanical action of a robotic exoskeleton to the electromyography (EMG) profile of the soleus muscle during walking. The powered exoskeleton produced an ankle dorsiflexion torque proportional to soleus muscle recruitment thus limiting the soleus' plantar flexion torque capability. We hypothesized that neurologically intact subjects would alter muscle activation patterns in response to the antagonistic exoskeleton by decreasing soleus recruitment. Subjects practiced walking with the exoskeleton for two 30-min sessions. The initial response to the perturbation was to "fight" the resistive exoskeleton by increasing soleus activation. By the end of training, subjects had significantly reduced soleus recruitment resulting in a gait pattern with almost no ankle push-off. In addition, there was a trend for subjects to reduce gastrocnemius recruitment in proportion to the soleus even though only the soleus EMG was used to control the exoskeleton. The results from this study demonstrate the ability of the nervous system to recalibrate locomotor output in response to substantial changes in the mechanical output of the soleus muscle and associated sensory feedback. This study provides further evidence that the human locomotor system of intact individuals is highly flexible and able to adapt to achieve effective locomotion in response to a broad range of neuromuscular perturbations.
Figures
Similar articles
-
Short-term locomotor adaptation to a robotic ankle exoskeleton does not alter soleus Hoffmann reflex amplitude.J Neuroeng Rehabil. 2010 Jul 26;7:33. doi: 10.1186/1743-0003-7-33. J Neuroeng Rehabil. 2010. PMID: 20659331 Free PMC article.
-
Learning to walk with a robotic ankle exoskeleton.J Biomech. 2007;40(12):2636-44. doi: 10.1016/j.jbiomech.2006.12.006. Epub 2007 Feb 2. J Biomech. 2007. PMID: 17275829 Clinical Trial.
-
Contributions to the understanding of gait control.Dan Med J. 2014 Apr;61(4):B4823. Dan Med J. 2014. PMID: 24814597 Review.
-
Motor modules during adaptation to walking in a powered ankle exoskeleton.J Neuroeng Rehabil. 2018 Jan 3;15(1):2. doi: 10.1186/s12984-017-0343-x. J Neuroeng Rehabil. 2018. PMID: 29298705 Free PMC article.
-
Medial gastrocnemius myoelectric control of a robotic ankle exoskeleton.IEEE Trans Neural Syst Rehabil Eng. 2009 Feb;17(1):31-7. doi: 10.1109/TNSRE.2008.2008285. IEEE Trans Neural Syst Rehabil Eng. 2009. PMID: 19211321 Free PMC article.
Cited by
-
EMG patterns during assisted walking in the exoskeleton.Front Hum Neurosci. 2014 Jun 16;8:423. doi: 10.3389/fnhum.2014.00423. eCollection 2014. Front Hum Neurosci. 2014. PMID: 24982628 Free PMC article.
-
Challenges and solutions for application and wider adoption of wearable robots.Wearable Technol. 2021 Nov 21;2:e14. doi: 10.1017/wtc.2021.13. eCollection 2021. Wearable Technol. 2021. PMID: 38486636 Free PMC article. Review.
-
Decoding the brain-machine interaction for upper limb assistive technologies: advances and challenges.Front Hum Neurosci. 2025 Feb 6;19:1532783. doi: 10.3389/fnhum.2025.1532783. eCollection 2025. Front Hum Neurosci. 2025. PMID: 39981127 Free PMC article. Review.
-
Development of a neural efficiency metric to assess human-exoskeleton adaptations.Front Robot AI. 2025 Apr 2;12:1541963. doi: 10.3389/frobt.2025.1541963. eCollection 2025. Front Robot AI. 2025. PMID: 40242512 Free PMC article.
-
Information about task duration influences energetic cost during split-belt adaptation and retention of walking patterns post-adaptation.bioRxiv [Preprint]. 2025 May 19:2024.05.24.595558. doi: 10.1101/2024.05.24.595558. bioRxiv. 2025. PMID: 38826397 Free PMC article. Preprint.
References
-
- Alexander RM. Energetics and optimization of human walking and running: the 2000 Raymond Pearl Memorial Lecture. Am J Hum Biol 14: 641–648, 2002 - PubMed
-
- Arsenault AB, Winter DA, Marteniuk RG. Is there a ‘normal’ profile of EMG activity in gait? Med Biol Eng Comput 24: 337–343, 1986 - PubMed
-
- Bertram JE, Ruina A. Multiple walking speed-frequency relations are predicted by constrained optimization. J Theor Biol 209: 445–453, 2001 - PubMed
Publication types
MeSH terms
Grants and funding
LinkOut - more resources
Full Text Sources
Other Literature Sources