. 2012 Dec;8(12):e1003081.
doi: 10.1371/journal.ppat.1003081. Epub 2012 Dec 20.

Transmission of equine influenza virus during an outbreak is characterized by frequent mixed infections and loose transmission bottlenecks

Affiliations

Transmission of equine influenza virus during an outbreak is characterized by frequent mixed infections and loose transmission bottlenecks

Joseph Hughes et al. PLoS Pathog. 2012 Dec.

Abstract

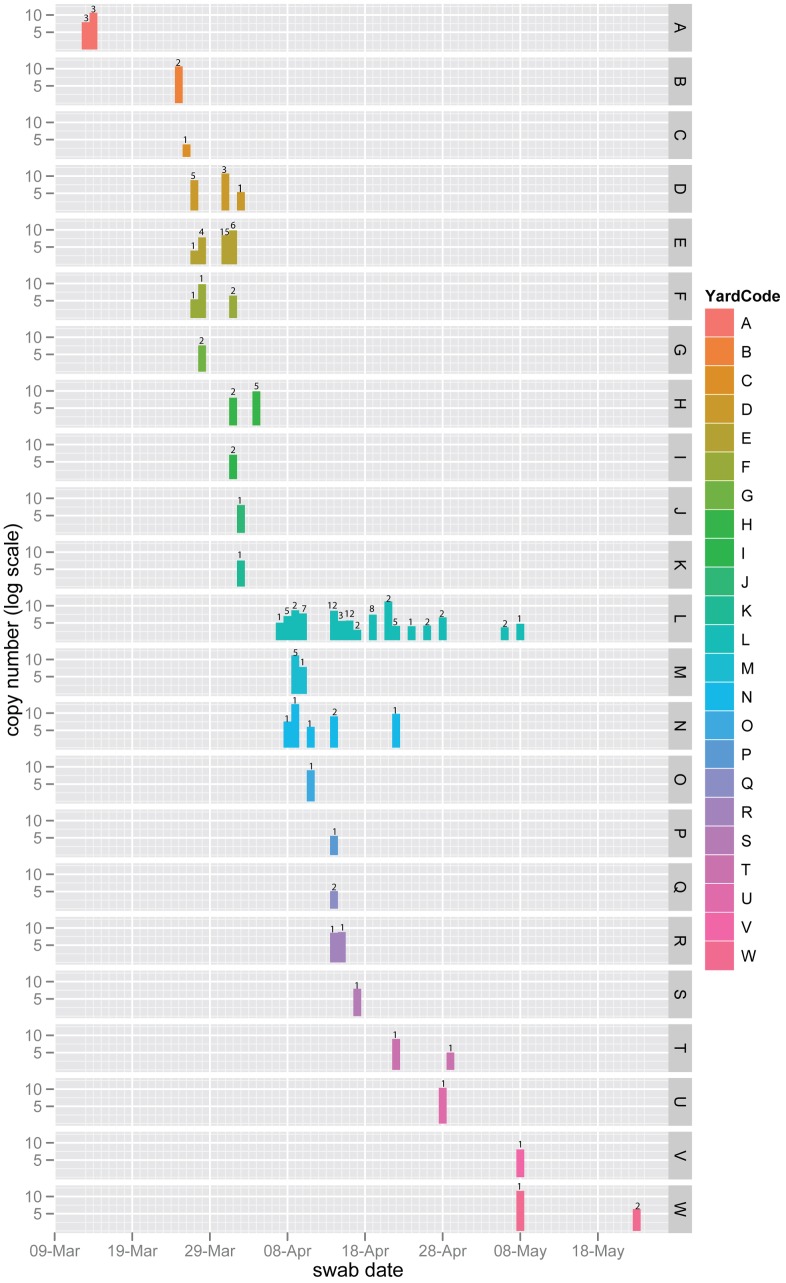
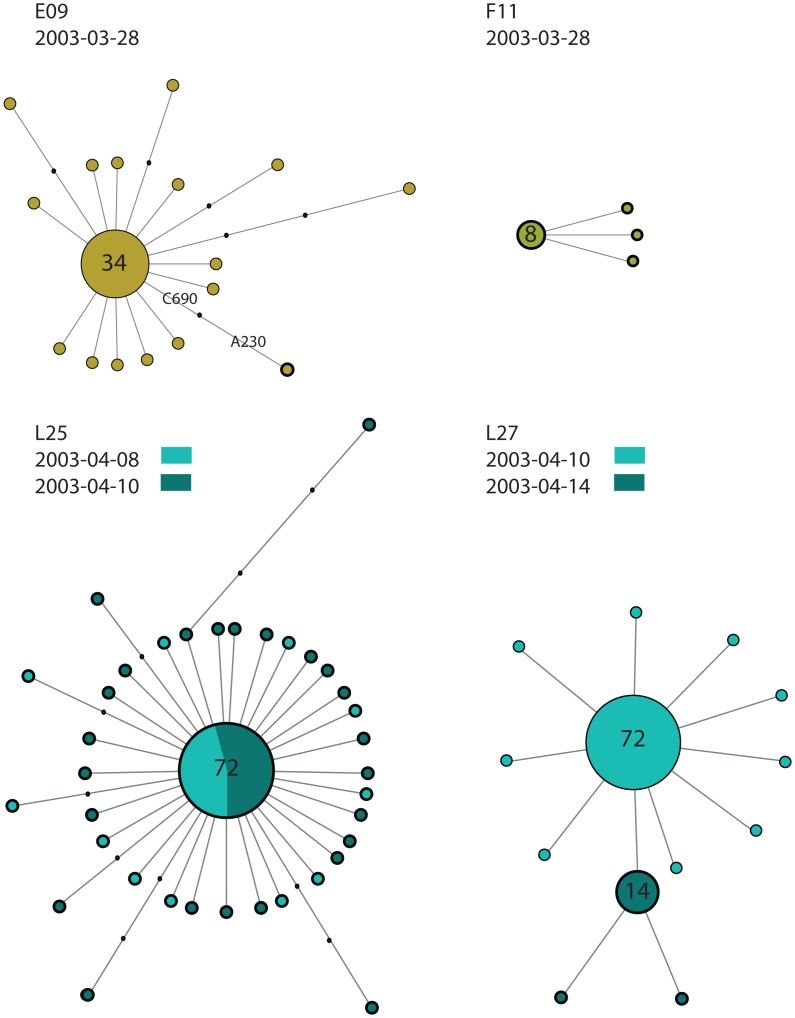
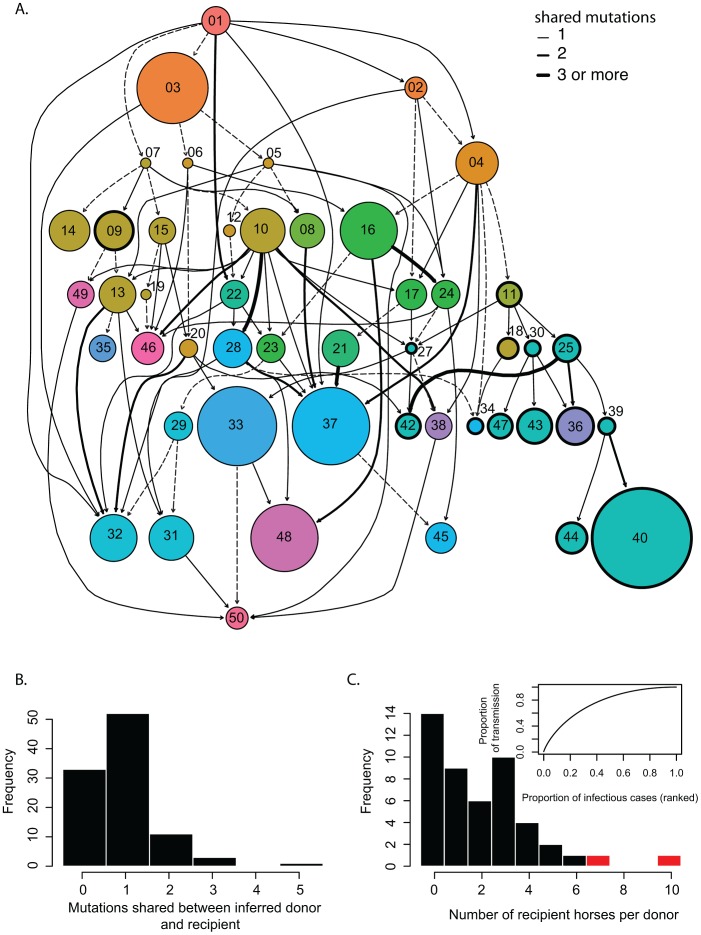
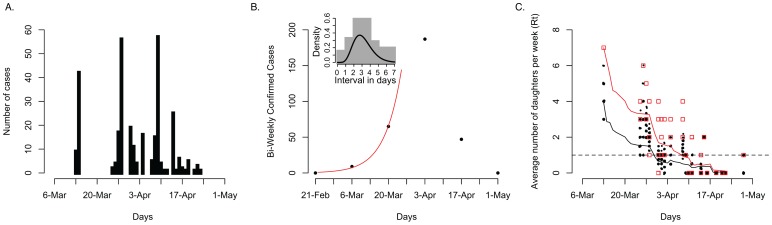
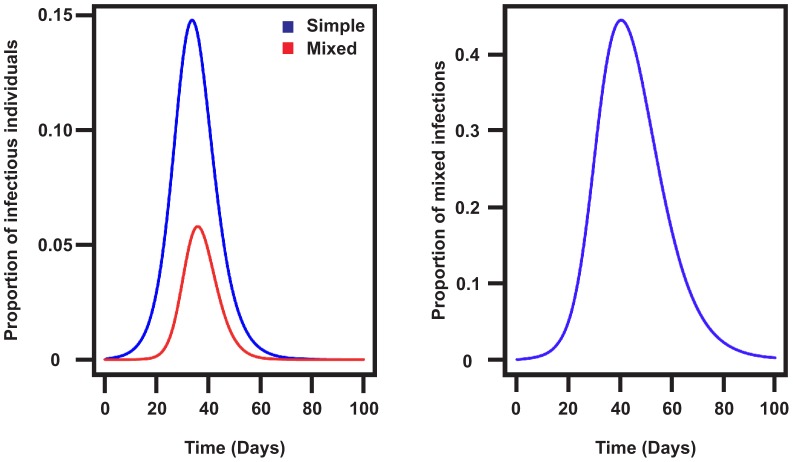
The ability of influenza A viruses (IAVs) to cross species barriers and evade host immunity is a major public health concern. Studies on the phylodynamics of IAVs across different scales - from the individual to the population - are essential for devising effective measures to predict, prevent or contain influenza emergence. Understanding how IAVs spread and evolve during outbreaks is critical for the management of epidemics. Reconstructing the transmission network during a single outbreak by sampling viral genetic data in time and space can generate insights about these processes. Here, we obtained intra-host viral sequence data from horses infected with equine influenza virus (EIV) to reconstruct the spread of EIV during a large outbreak. To this end, we analyzed within-host viral populations from sequences covering 90% of the infected yards. By combining gene sequence analyses with epidemiological data, we inferred a plausible transmission network, in turn enabling the comparison of transmission patterns during the course of the outbreak and revealing important epidemiological features that were not apparent using either approach alone. The EIV populations displayed high levels of genetic diversity, and in many cases we observed distinct viral populations containing a dominant variant and a number of related minor variants that were transmitted between infectious horses. In addition, we found evidence of frequent mixed infections and loose transmission bottlenecks in these naturally occurring populations. These frequent mixed infections likely influence the size of epidemics.


Conflict of interest statement

The authors have declared that no competing interests exist.

Figures

Figure 1
Figure 1. Daily cumulative viral shedding load per yard.
Vertical bars represent the sum of viral copy numbers estimated by real-time PCR from all horses sampled on the same day on a natural log scale. The numbers above the bars represent the number of horses. These data were derived from nasal swabs obtained from 120 different horses for which yard location and sampling date were known (n = 154). Yards (A to W) are color-coded and the date in which the sample was taken is shown on the x-axis.
Figure 2
Figure 2. Median joining networks illustrating the intra-host viral diversity of four representative horses.
The networks were generated from all the sequences from an individual horse and the size of the circle is relative to the sequence frequency. The color indicates the yard and day the sample was taken from. Sequences with A230 are circled with a thick line. Note that a single clone has A230 in horse E09. Black dots on the branch indicate the number of mutation differentiating two sequences.
Figure 3
Figure 3. Reconstruction of EIV transmission pathways during the outbreak.
(A) Transmission network inferred from the sequences, sampling date and locations for 48 horses. Each circle represents a horse colored according to training yard as in Figure 1. The size of the circle is proportional to the intra-host mean pairwise distance. Circles with thick black edges represent horses that have the A230 mutation. Arrows between circles represent inferred transmission events from the SeqTrack analysis. The corresponding number of mutations shared between any two horses is shown in the edge list in Table S2. Dashed arrows are for horses that only share the reference sequence. (B) Frequency distribution of the shared mutations between donor and recipient horses. (C) Distribution of the number of recipients per donor horse with the expected transmission caused by different percentage of cases (inset). The red bars represent the highly connected horses (E10 and the first sampled horse A01).
Figure 4
Figure 4. Transmission dynamics during the course of the outbreak.
(A) Influenza cases in Newmarket between the 13th of March 2003 to the 5th of May 2003. (B) Exponential epidemic growth in Newmarket (Rt 1.8) with the inset showing the distribution of serial intervals from experimental data and a gamma distribution curve of shape 7.4 and scale 0.42 (Dataset S4). (C) The effective reproductive number, Rt measured from the epidemic trees generated from randomly pruning the transmission network. Dots indicate the number of secondary cases resulting from each primary case (random jitter was used to avoid superposition on the x and y axis). The black line represents a moving average with a window size of 14 days. The red squares represent the number of offspring per sampled horse according to the transmission network and taking into account mixed infections and the red line is a moving average of those numbers.
Figure 5
Figure 5. The impact of mixed infections in the SEIR model.
(A) Proportion of infectious individuals in the basic SEIR model and the modified model. (B) Proportion of reinfections in the Newmarket vaccinated population using data from experiments with heterologous vaccination for the latent and infectious periods .

References

    1. Smith GJD, Vijaykrishna D, Bahl J, Lycett SJ, Worobey M, et al. (2009) Origins and evolutionary genomics of the 2009 swine-origin H1N1 influenza A epidemic. Nature 459: 1122–U1107. - PubMed
    1. Murcia PR, Baillie GJ, Daly J, Elton D, Jervis C, et al. (2010) Intra- and interhost evolutionary dynamics of equine influenza virus. J Virol 84: 6943–6954. - PMC - PubMed
    1. Murcia PR, Hughes J, Battista P, Lloyd L, Baillie GJ, et al. (2012) Evolution of an Eurasian avian-like influenza virus in naive and vaccinated Pigs. PLoS Pathog 8: e1002730. - PMC - PubMed
    1. Grenfell BT, Pybus OG, Gog JR, Wood JL, Daly JM, et al. (2004) Unifying the epidemiological and evolutionary dynamics of pathogens. Science 303: 327–332. - PubMed
    1. Webster RG (1993) Are equine 1 influenza viruses still present in horses? Equine Vet J 25: 537–538. - PubMed

Publication types

MeSH terms