. 2013;8(1):e53082.
doi: 10.1371/journal.pone.0053082. Epub 2013 Jan 8.

Developmental and visual input-dependent regulation of the CB1 cannabinoid receptor in the mouse visual cortex

Affiliations

Developmental and visual input-dependent regulation of the CB1 cannabinoid receptor in the mouse visual cortex

Taisuke Yoneda et al. PLoS One. 2013.

Abstract

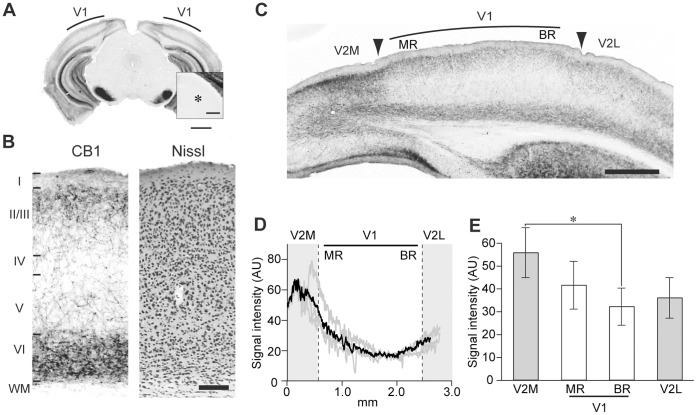
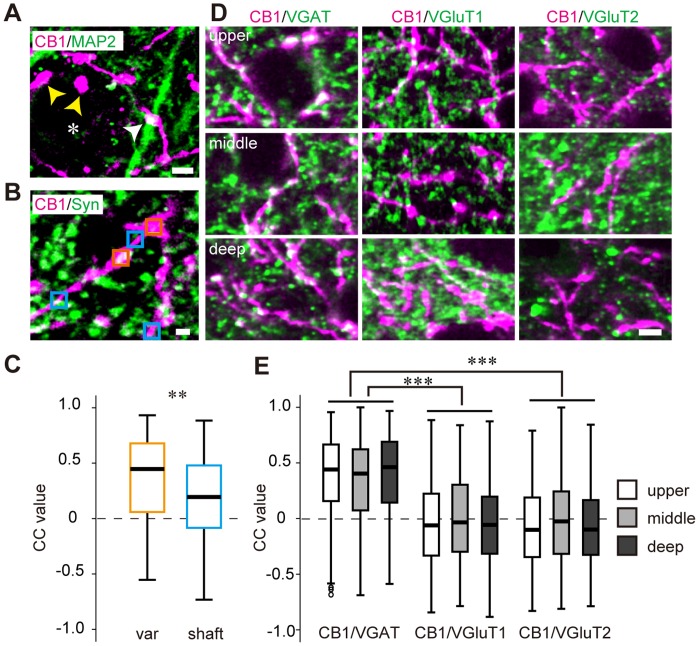
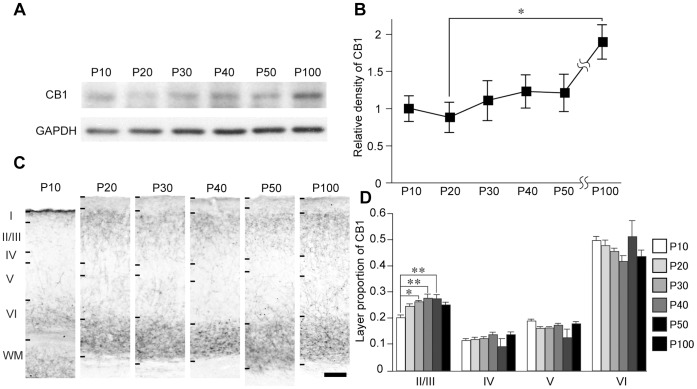
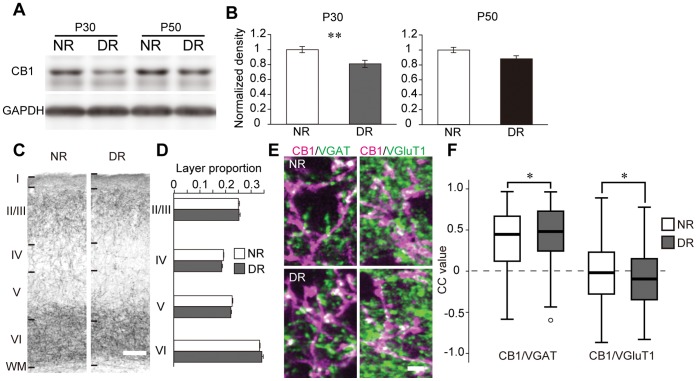
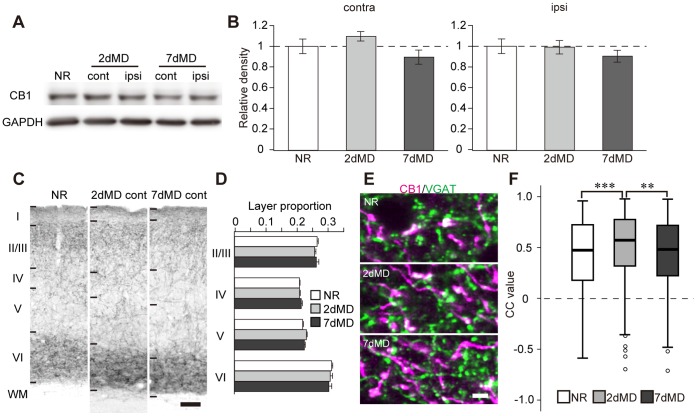
The mammalian visual system exhibits significant experience-induced plasticity in the early postnatal period. While physiological studies have revealed the contribution of the CB1 cannabinoid receptor (CB1) to developmental plasticity in the primary visual cortex (V1), it remains unknown whether the expression and localization of CB1 is regulated during development or by visual experience. To explore a possible role of the endocannabinoid system in visual cortical plasticity, we examined the expression of CB1 in the visual cortex of mice. We found intense CB1 immunoreactivity in layers II/III and VI. CB1 mainly localized at vesicular GABA transporter-positive inhibitory nerve terminals. The amount of CB1 protein increased throughout development, and the specific laminar pattern of CB1 appeared at P20 and remained until adulthood. Dark rearing from birth to P30 decreased the amount of CB1 protein in V1 and altered the synaptic localization of CB1 in the deep layer. Dark rearing until P50, however, did not influence the expression of CB1. Brief monocular deprivation for 2 days upregulated the localization of CB1 at inhibitory nerve terminals in the deep layer. Taken together, the expression and the localization of CB1 are developmentally regulated, and both parameters are influenced by visual experience.


Conflict of interest statement

Competing Interests: The authors have declared that no competing interests exist.

Figures

Figure 1
Figure 1. Distribution of CB1 in the visual cortex.
(A) Low-magnification image of a coronal section of mouse brain at P30, immunostained for CB1. Inset, magnified view of LGN (*). Scale, 1 mm and 250 µm (inset). (B) Layer distribution of CB1 immunoreactivity in V1 (CB1). Layer boundaries were determined in neighboring Nissl-stained sections (Nissl). Scale, 100 µm. (C) Regional distribution of CB1 immunoreactivity in the visual cortex. Arrowheads indicate the boundaries between V1 and V2, determined in Nissl-stained sections. V2M: secondary visual cortex medial area, V2L: secondary visual cortex lateral area, MR: monocular region, BR: binocular region. Scale, 500 µm. (D) Horizontal profiles of CB1 immunoreactivity across the visual cortex. Signal intensity was measured in layer II/III. Dotted lines indicate region boundaries. The gray lines represent the profiles in individual sections obtained from an animal, and the black line represents the mean of them. AU indicates arbitrary units. (E) Mean signal intensity of CB1 in each visual cortical region. The error bars indicate SEM (n = 5 animals, one-way repeated measured ANOVA, p<0.05, post hoc Tukey’s test, *: p<0.05).
Figure 2
Figure 2. Synaptic localization of CB1 in V1.
(A) Double immunofluorescent staining of CB1 (magenta) and MAP2 (green) in the upper layer of V1. CB1-positive varicosities presumably contact MAP2-positive dendrites (white arrowheads) and soma (asterisk, yellow arrowheads). Scale, 3 µm. (B) Double immunofluorescent staining of CB1 (magenta) and synaptophysin (green) in the upper layer of V1. Rectangles indicate the ROIs for the correlation coefficient (CC) analysis set on varicosities (orange) and shafts (blue) of CB1-positive structures. Scale, 1 µm. (C) Box and whisker plots showing the CC values of CB1 and synaptophysin in varicosities (var, n = 154 ROIs) and shafts (shaft, n = 140 ROIs). The horizontal lines show the 25th, 50th, and 75th percentiles, and the whiskers show the max and minimum values. Mann-Whitney U test, **: p<0.01. (D) Double immunofluorescent staining of CB1 (magenta) and VGAT, VGluT1, VGluT2 (green). Representative photographs of the upper layer (top row), middle layer (middle row), and deep layer (bottom row) of V1. Scale, 3 µm. (E) Box and whisker plots showing the CC values of CB1 and VGAT, VGluT1, or VGluT2 in each layer of V1 (n = 6 animals each; in the upper layer, n = 1226 ROIs (CB1/VGAT), 1203 ROIs (CB1/VGluT1), 1212 ROIs (CB1/VGluT2); in the middle layer, n = 492 ROIs (CB1/VGAT), 435 ROIs (CB1/VGluT1), 498 ROIs (CB1/VGluT2); in the deep layer, n = 1556 ROIs (CB1/VGAT), 1712 ROIs (CB1/VGluT1), 1492 ROIs (CB1/VGluT2)). The small circles indicate the outliers of the distribution of the CC values. In the box and whisker plots containing the outliers, the bottom of the whisker shows the value of the 25th percentile-1.5IQR. Statistical comparison among layers was performed by Bonferroni-corrected Mann-Whitney U test (***: p<0.00033).
Figure 3
Figure 3. Developmental change of CB1 expression in V1.
(A) Representative western blots of CB1 and GAPDH in V1 at different postnatal ages. (B) Mean and SEM of CB1 blot densities of each age group (n = 8 hemispheres each from 4 animals, one-way factorial ANOVA, p<0.05, post hoc Tukey’s test, *: p<0.05). The blot densities were normalized to the mean density of P10. (C) CB1 immunostaining of the binocular region of V1 at postnatal ages indicated on top. Scale, 100 µm. (D) Layer distribution of CB1 immunoreactivity in the binocular region of V1 at different postnatal ages. Mean and SEM of CB1 signal intensity in each layer represented as the proportion to the all-layer intensity (n = 4 animals, one-way factorial ANOVA, p<0.05; layer II/III, p>0.05; layers IV, V, and VI, post hoc Tukey’s test, *: p<0.05, **: p<0.01).
Figure 4
Figure 4. Effects of dark rearing on CB1 expression.
(A) Representative western blots of CB1 and GAPDH in V1. The blots of normal light/dark condition-reared (NR) and dark-reared (DR) mice at P30 and P50 are shown. (B) Mean and SEM of the blot density of CB1 (P30: n = 16 (NR) and 21 (DR) animals, P50: n = 5 (NR) and 5 (DR) animals; unpaired t-test, **: p<0.01). (C) Layer distribution of CB1 immunoreactivity in V1. Photographs represent immunostained sections of NR and DR animals at P30. Layer boundaries were determined in neighboring Nissl-stained sections. Scale, 100 µm. (D) CB1 immunoreactivity in individual layers of NR and DR animals at P30. Intensities in each layer are represented as the proportion to the all-layer intensities (two-way ANOVA, p>0.05). (E) Double immunofluorescent staining of CB1 (magenta) and VGAT, VGluT1 in the deep layer of V1 of NR (upper) and DR (lower) animals at P30. Scale, 3 µm. (F) Box and whisker plots showing the CC values of CB1 and VGAT, VGluT1 in the deep layer of NR and DR animals at P30 (n = 3 animals each; NR animals: n = 531 ROIs (CB1/VGAT), 244 ROIs (CB1/VGluT1), DR animals: n = 594 ROIs (CB1/VGAT), 343 ROIs (CB1/VGluT1), Mann-Whitney U test, *: p<0.05).
Figure 5
Figure 5. Effects of monocular deprivation on CB1 expression.
(A) Representative western blots of CB1 and GAPDH in V1∶2 dMD and 7 dMD indicate monocular deprivation for two days and seven days, respectively. The blots of V1, which is contralateral (cont) or ipsilateral (ipsi) to the deprived eye, are represented with that of the normal animal (NR). (B) Mean and SEM of the blot density of CB1 in MD animals normalized to the mean of normal animals (n = 10 animals each, one-way factorial ANOVA, p>0.05). (C) Representative photographs of CB1 immunoreactivity in V1 of normal and MD animals. Scale, 100 µm. (D) Layer proportion of CB1 immunoreactivity was not significantly different among animal groups (two-way ANOVA, p>0.05). (E) Double immunofluorescent staining of CB1 (magenta) and VGAT (green) in the deep layer of V1 of normal and MD animals. The images of MD animals were obtained in the hemisphere contralateral to the deprived eye. Scale, 3 µm. (F) The CC values of CB1/VGAT in the deep layer of V1, which is contralateral to the deprived eye (n = 3 animals each; n = 386 ROIs (NR), 380 ROIs (2 dMD), 389 ROIs (7 dMD), Bonferroni-corrected Mann-Whitney U-test, **: p<0.0033, ***: p<0.00033).

References

    1. Wiesel TN, Hubel DH (1963) Single-cell responses in striate cortex of kittens deprived of vision in one eye. J Neurophysiol 26: 1003–1017. - PubMed
    1. Gordon JA, Stryker MP (1996) Experience-dependent plasticity of binocular responses in the primary visual cortex of the mouse. J Neurosci 16: 3274–3286. - PMC - PubMed
    1. Olson CR, Freeman RD (1980) Profile of the sensitive period for monocular deprivation in kittens. Exp Brain Res 39: 17–21. - PubMed
    1. Mower GD (1991) The effect of dark rearing on the time course of the critical period in cat visual cortex. Brain Res Dev Brain Res 58: 151–158. - PubMed
    1. Hensch TK (2005) Critical period plasticity in local cortical circuits. Nat Rev Neurosci 6: 877–888. - PubMed

Publication types

Substances

LinkOut - more resources