. 2013;8(1):e53337.
doi: 10.1371/journal.pone.0053337. Epub 2013 Jan 7.

Dual function of novel pollen coat (surface) proteins: IgE-binding capacity and proteolytic activity disrupting the airway epithelial barrier

Affiliations

Dual function of novel pollen coat (surface) proteins: IgE-binding capacity and proteolytic activity disrupting the airway epithelial barrier

Mohamed Elfatih H Bashir et al. PLoS One. 2013.

Abstract

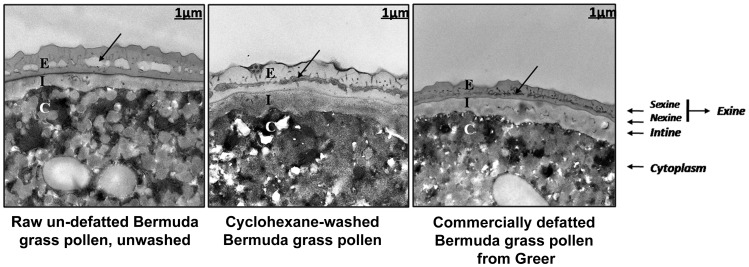
Background: The pollen coat is the first structure of the pollen to encounter the mucosal immune system upon inhalation. Prior characterizations of pollen allergens have focused on water-soluble, cytoplasmic proteins, but have overlooked much of the extracellular pollen coat. Due to washing with organic solvents when prepared, these pollen coat proteins are typically absent from commercial standardized allergenic extracts (i.e., "de-fatted"), and, as a result, their involvement in allergy has not been explored.

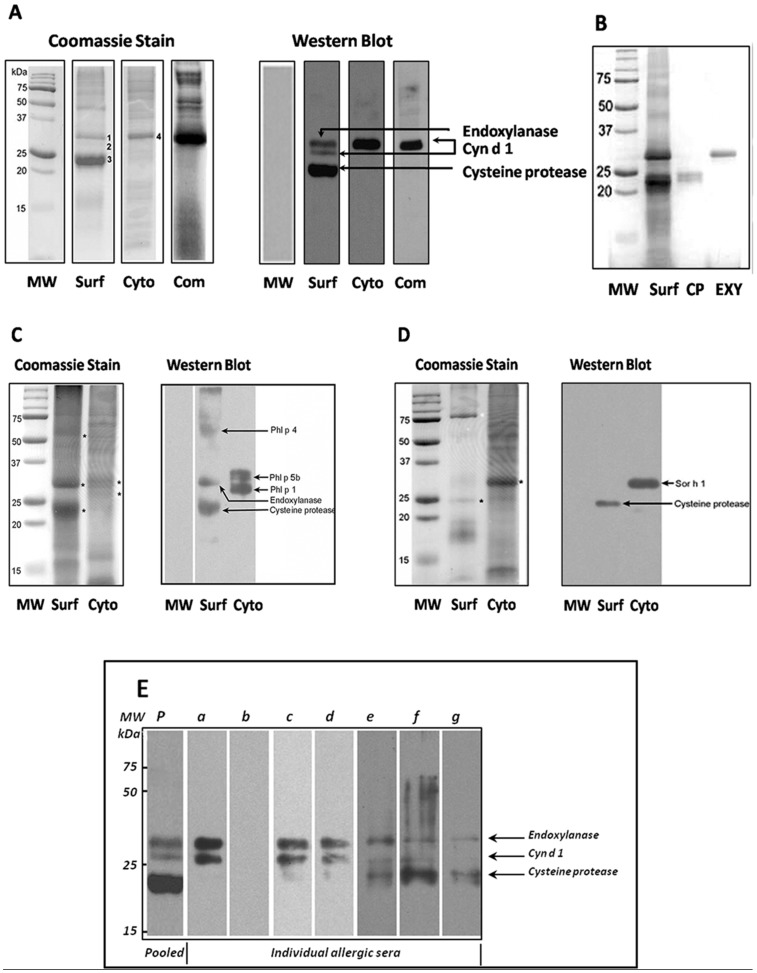
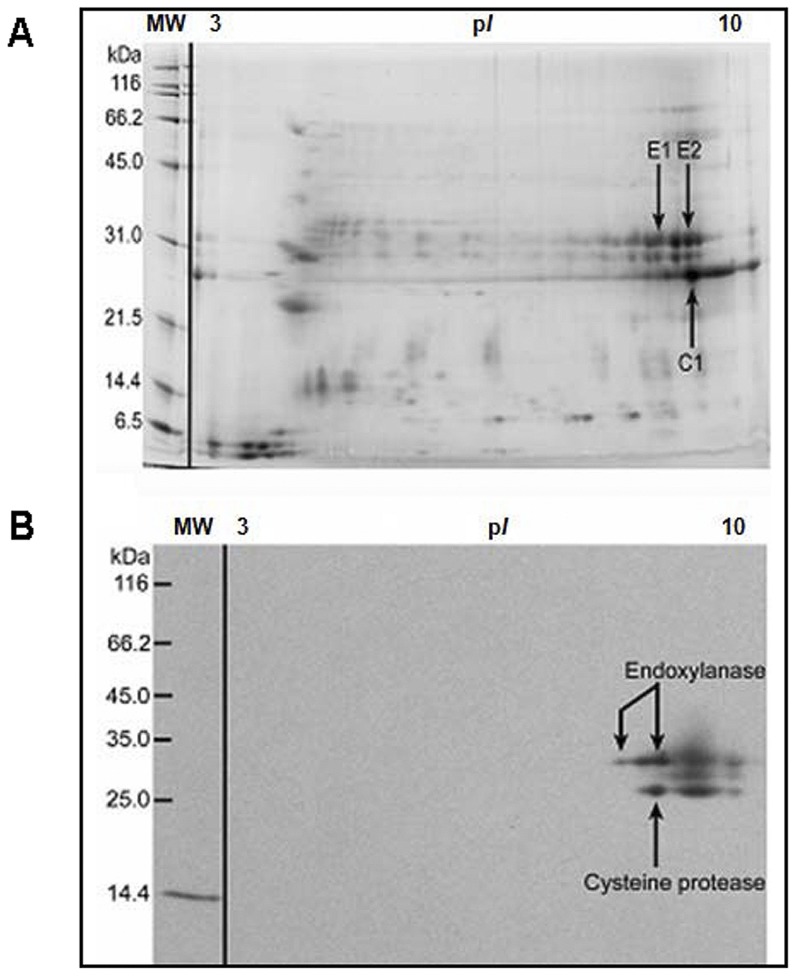
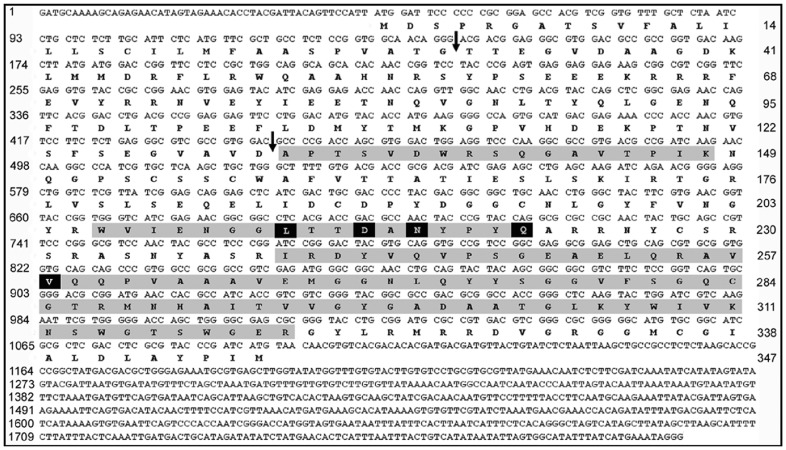
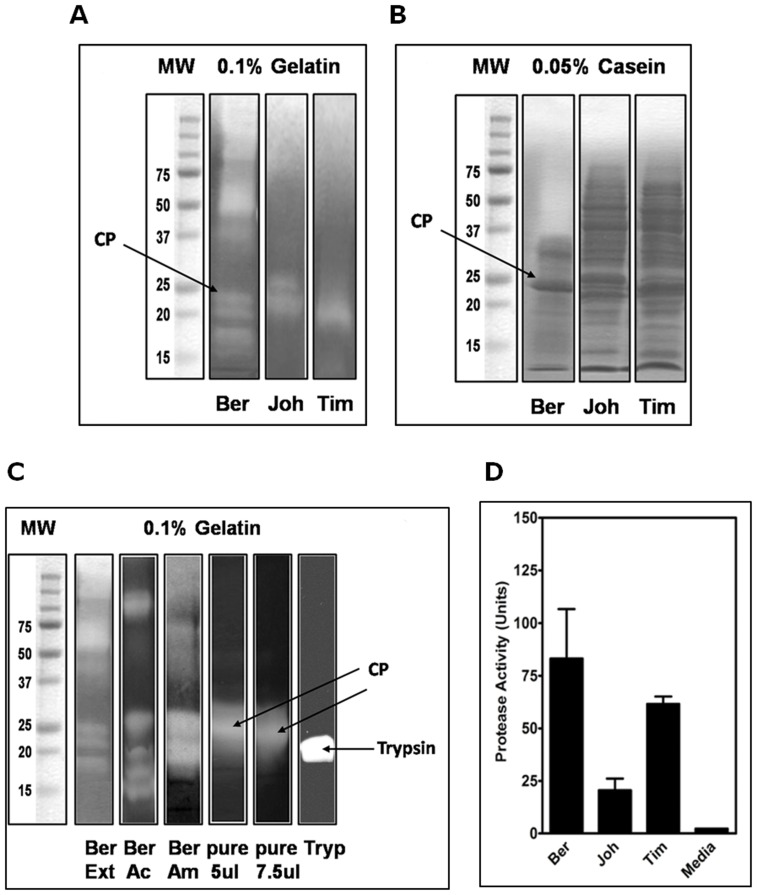
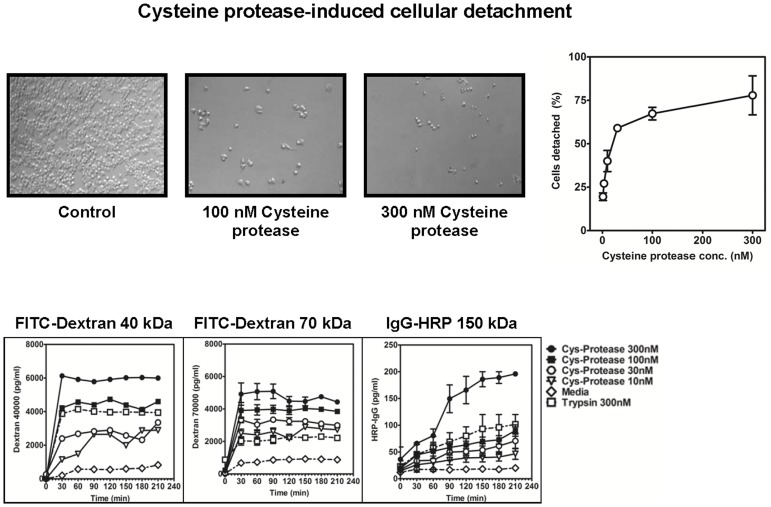
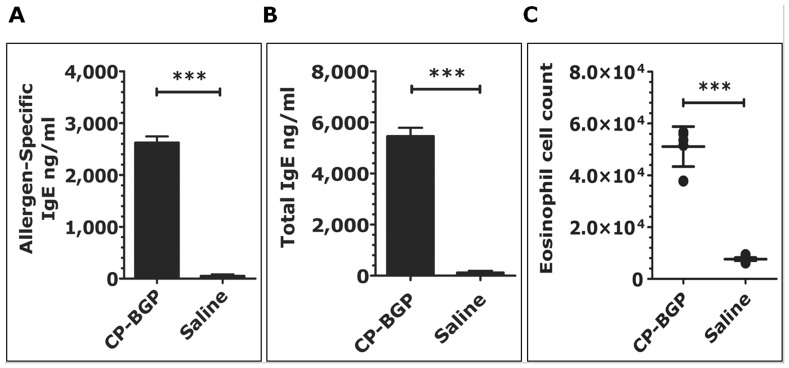
Methodology/principal findings: Using a unique approach to search for pollen allergenic proteins residing in the pollen coat, we employed transmission electron microscopy (TEM) to assess the impact of organic solvents on the structural integrity of the pollen coat. TEM results indicated that de-fatting of Cynodon dactylon (Bermuda grass) pollen (BGP) by use of organic solvents altered the structural integrity of the pollen coat. The novel IgE-binding proteins of the BGP coat include a cysteine protease (CP) and endoxylanase (EXY). The full-length cDNA that encodes the novel IgE-reactive CP was cloned from floral RNA. The EXY and CP were purified to homogeneity and tested for IgE reactivity. The CP from the BGP coat increased the permeability of human airway epithelial cells, caused a clear concentration-dependent detachment of cells, and damaged their barrier integrity.

Conclusions/significance: Using an immunoproteomics approach, novel allergenic proteins of the BGP coat were identified. These proteins represent a class of novel dual-function proteins residing on the coat of the pollen grain that have IgE-binding capacity and proteolytic activity, which disrupts the integrity of the airway epithelial barrier. The identification of pollen coat allergens might explain the IgE-negative response to available skin-prick-testing proteins in patients who have positive symptoms. Further study of the role of these pollen coat proteins in allergic responses is warranted and could potentially lead to the development of improved diagnostic and therapeutic tools.


Conflict of interest statement

Competing Interests: Dr. Daphne Preuss left the University of Chicago to work at Chromatin, Inc., 3440 S. Dearborn St., Chicago, Illinois,60616, United States of America. Dr. Jason M. Ward was Post-doctoral scholar at the University of Chicago. Now he works at Monsanto Company, 700 Chesterfield Parkway North, St. Louis, Missouri 63017, United States of America. This does not alter the authors' adherence to all the PLOS ONE policies on sharing data and materials.

Figures

Figure 1
Figure 1. Transmission electron micrographs (TEMs) of BGP after extraction with organic solvents.
The microchannels of the raw un-defatted pollen grain are covered with electron-dense surface coat materials, whereas in defatted pollen the microchannels of the surface coat are almost empty of electron-dense material. The microchannels of the exine layer, indicated by arrows, appear to collapse after organic-solvent extraction. The close proximity of the exines’ dark-staining inner channel surfaces makes the collapsed channels of the washed pollen darker than those of the raw un-defatted pollen. The supplier washes un-defatted pollen with n-Hexane to produce commercially defatted pollen. E, exine; I, intine; C, cytoplasm.
Figure 2
Figure 2. SDS-PAGE and immunoblotting analyses of in-lab preparations of pollen surface (coat), cytoplasmic proteins and commercial defatted pollen from Bermuda grass, Timothy grass, and Johnson grass.
Raw un-defatted pollens were extracted with cyclohexane. Cyclohexane-soluble proteins (pollen coat) were separated, and the remaining cyclohexane-defatted pollen was used for isolation of the cytoplasmic fraction. MW markers, surface pollen coat and cytoplasmic proteins, and commercial defatted Bermuda grass pollen (Greer) were resolved by (A) SDS-PAGE and stained with Coomassie blue (left panel) or transferred to nitrocellulose membranes, probed with human pooled allergic sera, and detected with anti-human IgE antibodies (right panel) as described in Materials and Methods. Three numbered protein bands, 1, 2, and 3, from the Bermuda pollen surface, denoted IgE-reactive proteins identified in the immunoblot, were sequenced and identified via MALDI-TOF-MS and peptide sequencing as endoxylanase (EXY), major allergen Cyn d 1, and cysteine protease (CP). The BGP coat proteins were resolved by SDS-PAGE. Proteins identified as IgE-reactive CP and EXY were cut from the gel and electro-eluted for high purification of each protein (B). The pollen surfaces of (C) Timothy and (D) Johnson grass pollens also contain IgE-reactive CP. Three protein bands from the Timothy pollen surface, indicated by stars, were sequenced and identified as major allergen Phl p 4, EXY, and CP. A CP was identified from the Johnson grass surface. The data shown are taken from one representative experiment repeated three times. (E) Frequency and identity of IgE-reactivity of Bermuda pollen surface proteins. Proteins were analyzed by Western blotting for the presence of IgE and tested with pooled (p) and individual (a–g) pollen-allergic patients’ sera. Each lane corresponds to an allergic patient serum. The 23 kDa band was identified as CP. The data shown are taken from 1 representative experiment repeated three times.
Figure 3
Figure 3. 2D-SDS-PAGE of BGP coat proteins (cyclohexane-soluble) stained with Sypro Ruby and IgE-immunoblotting.
Pollen coat proteins were separated first by isoelectric point and then by molecular weight. Labeled spots were excised, destained, and digested with trypsin for peptide mass fingerprinting. (A) The identities of spots E1, E2, and C1 were verified by mass-spectrum peptide identification as two endoxylanases and a cysteine protease. Two-dimensional IgE-immunoblotting of BGP coat proteins (B). Approximately 50 µg of pollen coat proteins were loaded into an IPG strip (pH 3–10). Following 2D-SDS-PAGE, Western blotting was performed, and the membranes were probed with human pooled allergic sera and detected with anti-human IgE antibodies as shown in Figure 2. The IgE-reactive spots corresponded to E1, E2, and C1 spots on 2D-SDS-PAGE in Figure A. IgE in the pooled sera also reacted with the 14.4 kDa mass marker, lysozyme from chicken egg white. 2D-SDS-PAGE and 2D-Western blot were repeated three times and generally found to be reproducible.
Figure 4
Figure 4. Cloning of the full-length cDNA and protein sequence of the BGP coat, IgE-reactive cysteine protease.
The full-length cDNA sequence was cloned from Bermuda grass floral RNA. The protein sequence appears below the mRNA open reading frame. The numbers on the left indicate the nucleotide position at the beginning of each line. The numbers on the right indicate the amino-acid position at the end of each line. The arrows indicate the putative cleavage site for the signal peptide (top arrow) and the cleavage site of the pro-domain (bottom arrow). Gray shading indicates IgE-reactive band peptide sequence obtained from peptide sequencing by Edman degradation that matches the cDNA sequence. Sequences that do not match peptide-sequencing results are shaded in black.
Figure 5
Figure 5. Total proteinase activity of pollen coat proteins from Bermuda, Timothy, and Johnson grass assessed by gelatin and casein zymography.
Bands with proteinase activity were visualized as white clear or light lytic zones against a dark background of Coomassie-blue-stained gel (A, gelatin) and (B, casein). On the left, molecular mass markers in kDa are indicated. (C) Pollen coat proteins from Bermuda grass. MW markers were on the left lane, and crude extracts (Ext), concentrated with 80% Acetone (Ac) and with 70% ammonium sulfate (Am), pure cysteine protease (pure, 5 and 7.5 µg/lane) and trypsin as a positive control are shown. The gelatin zymography gives a representative image from 4 separate studies that yielded similar results. (D) Protease activities in pollen surface proteins from Bermuda, Johnson, and Timothy grass corresponding to the lanes in (A) and (B) in the upper panels. The protease activities of pollen surface proteins, equalized for protein concentration, were examined for proteinase activity by use of a chromogenic substrate. The activity was recorded and expressed as units of enzyme activity per milligram of total protein. The cysteine protease colorimetric assay shows significantly greater proteinase activity in the proteins extracted from the Bermuda grass pollen surface compared with proteins extracted from Johnson grass or Timothy grass pollen surface. Bars represent the mean of proteinase activity units of four replicates.
Figure 6
Figure 6. Concentration-dependent detachment of airway epithelial cells by pollen cysteine protease.
Confluent monolayers of A549 epithelial cells were treated with Bermuda pollen coat cysteine protease for a 3-hour period (upper left panels). After light microscopic observation, cell detachment was assessed as described in Materials and Methods. Light-microscopic photos of the average cell density of the epithelial cell exposed to the serum-free medium F-12 (0 nM) and to serum-free media containing (300 nM) cysteine protease are shown. After 1 hour of incubation, the cells were analyzed by light-microscopic imaging. Microscopic images were taken at ×10 magnification. Bar = 25 um. Each image is representative of three individual wells. Following microscopy, the percentage of detached cells was determined and is expressed as a percentage relative to detachment observed in untreated control cells (upper right panel). Error bars represent means ± SD of four independent experiments. Pollen coat cysteine protease increases paracellular permeability of A549 epithelial cells (lower panel). The apical surface of the confluent A549 airway epithelial monolayers were left untreated (0) or treated with a solution of 1, 3, 10, 30, 100 or 300 nM purified cysteine protease for the indicated time. Paracellular permeability of epithelial cells by measurement of the apical-to-basolateral flux of FITC-dextran 40 kDa, FITC-dextran 70 kDa and IgG-HRP 150 kDa as described in Materials and Methods are shown.
Figure 7
Figure 7. Stimulation of human airway epithelial cells with pollen coat proteins generates the pro-inflammatory cytokines IL-6, IL-8, IL-10, IL-13, IL-17, and TNF-α.
Confluent airway epithelial cells were stimulated with Bermuda, Johnson, or Timothy pollen coat proteins (25 µg/ml) for 24 h, and cytokine levels in the culture media were measured by ELISA (A). Each bar represents mean ± SEM. Data are representative of 3 separate experiments. Significantly increased IL-8 levels were present in pollen surface protein-treated samples compared with PBS-treated samples (P≤0.05). Pollen coat protein PMN transmigration across airway epithelial cells (B). A549 monolayers were exposed to 25 µg pollen coat proteins, and the number of PMNs that had completely migrated across the epithelium into the apical chamber were quantified and presented as number of PMNs multiplied by 104. HBSS medium represents untreated monolayers. Data represent mean ± SEM of three experiments each performed in triplicate.
Figure 8
Figure 8. Intranasal administration of CP BPG enhances the allergen-specific IgE and total IgE Abs response.
Four weeks after the initial intranasal sensitization mice were bled. Allergen-specific IgE (A), total IgE (B) levels in sera from CP-BGP or saline C57BL/6 mice were measured by ELISA. Individual serum samples were measured and expressed as the geometric means ± SEM (n = 5 per group). (C) Increased eosinophil influx into nasal mucosa of C57BL/6 mice sensitized intranasally with CP-BGP. Cell counts were determined by differential FACS staining of cells isolated from the nasal mucosa. Data is shown as mean ± SD (n = 5 per group). Significant differences (*** p<0.001 compared with paired control group. One representative experiment of two is shown.

References

    1. Stingone JA, Claudio L (2008) Disparities in allergy testing and health outcomes among urban children with asthma. J Allergy Clin Immunol 122: 748–753. - PubMed
    1. Suvilehto J, Seppanen M, Notkola IL, Antikainen M, Malmberg H, et al. (2007) Association of allergy, asthma and IgE sensitisation to adenoidectomy and infections in children. Rhinology 45: 286–291. - PubMed
    1. Nathan RA (2007) The burden of allergic rhinitis. Allergy Asthma Proc 28: 3–9. - PubMed
    1. Verdino P (2006) Structural characterization of pollen allergens. Clinical Reviews in Allergy & Immunology 30: 73–95. - PubMed
    1. Tao AL, He SH (2005) Cloning, expression, and characterization of pollen allergens from Humulus scandens (Lour) Merr and Ambrosia artemisiifolia L. Acta Pharmacol Sin. 26: 1225–1232. - PubMed

Publication types

MeSH terms