

[18F]FLT and [18F]FDG PET for non-invasive treatment monitoring of the nicotinamide phosphoribosyltransferase inhibitor APO866 in human xenografts
- PMID: 23308217
- PMCID: PMC3537726
- DOI: 10.1371/journal.pone.0053410
[18F]FLT and [18F]FDG PET for non-invasive treatment monitoring of the nicotinamide phosphoribosyltransferase inhibitor APO866 in human xenografts
Abstract
Introduction: APO866 is a new anti-tumor compound inhibiting nicotinamide phosphoribosyltransferase (NAMPT). APO866 has an anti-tumor effect in several pre-clinical tumor models and is currently in several clinical phase II studies. 3'-deoxy-3'-[18F]fluorothymidine ([18F]FLT) is a tracer used to assess cell proliferation in vivo. The aim of this study was non-invasively to study effect of APO866 treatment on [18F]FLT and 2-deoxy-2-[18F]fluoro-D-glucose ([18F]FDG) uptake.
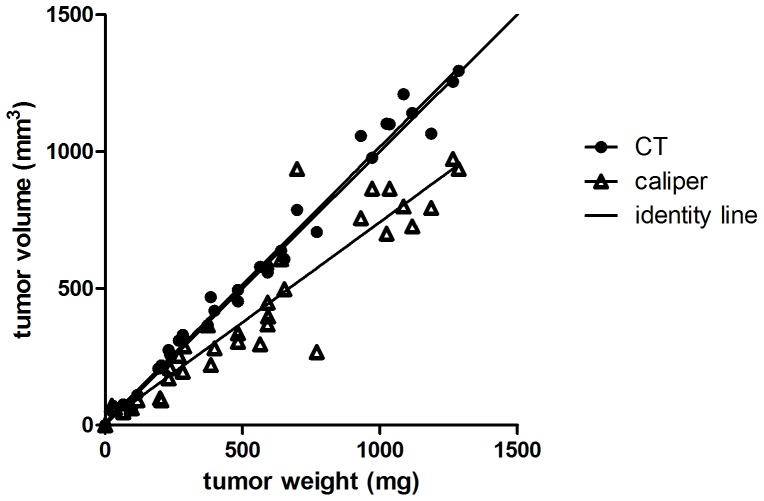
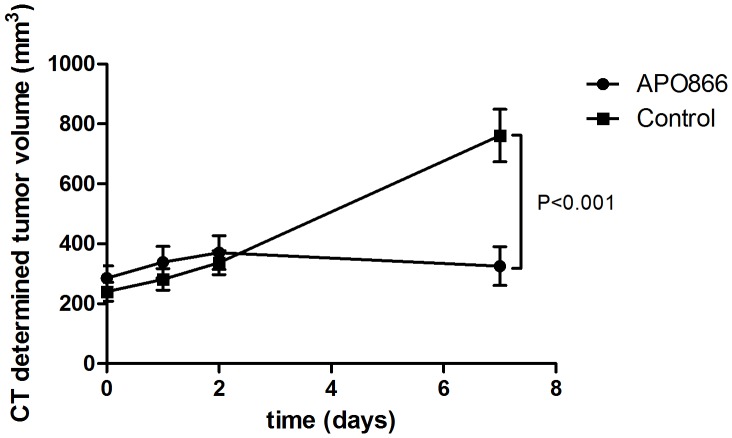
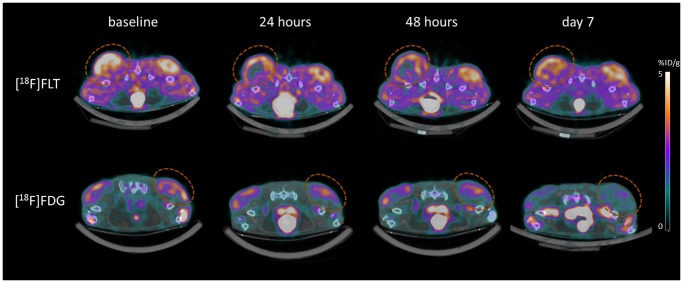
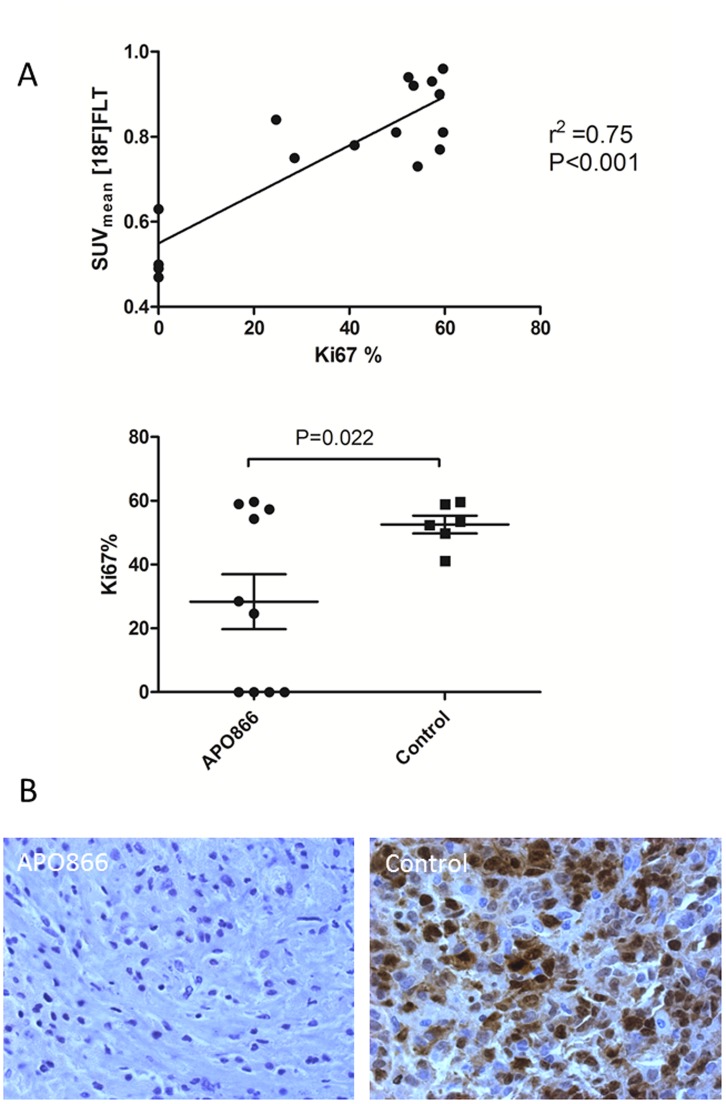
Methods: In vivo uptake of [18F]FLT and [18F]FDG in human ovary cancer xenografts in mice (A2780) was studied at various time points after APO866 treatment. Baseline [18F]FLT or [18F]FDG scans were made before treatment and repeated after 24 hours, 48 hours and 7 days. Tumor volume was followed with computed tomography (CT). Tracer uptake was quantified using small animal PET/CT. One hour after iv injection of tracer, static PET scans were performed. Imaging results were compared with Ki67 immunohistochemistry.
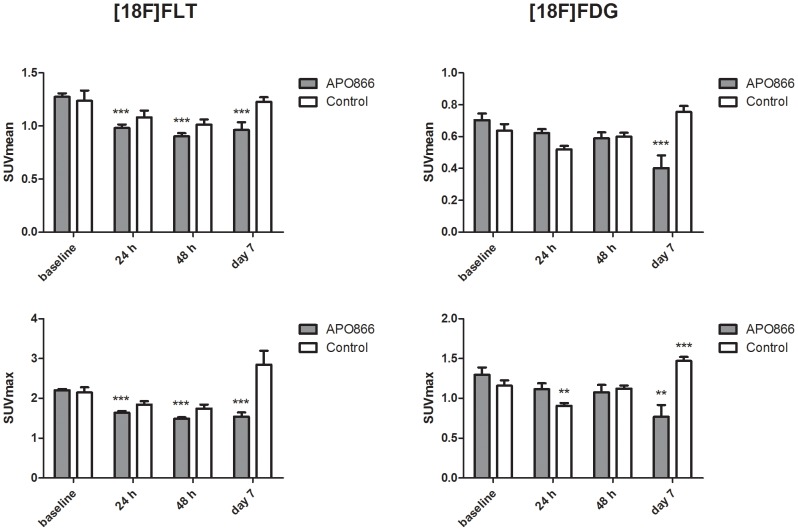
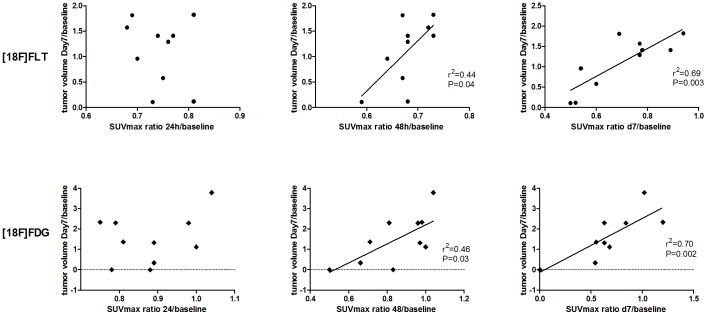
Results: Tumors treated with APO866 had volumes that were 114% (24 h), 128% (48 h) and 130% (Day 7) relative to baseline volumes at Day 0. In the control group tumor volumes were 118% (24 h), 145% (48 h) and 339% (Day 7) relative to baseline volumes Day 0. Tumor volume between the treatment and control group was significantly different at Day 7 (P = 0.001). Compared to baseline, [18F]FLT SUVmax was significantly different at 24 h (P<0.001), 48 h (P<0.001) and Day 7 (P<0.001) in the APO866 group. Compared to baseline, [18F]FDG SUVmax was significantly different at Day 7 (P = 0.005) in the APO866 group.
Conclusions: APO866 treatment caused a significant decrease in [18F]FLT uptake 24 and 48 hours after treatment initiation. The early reductions in tumor cell proliferation preceded decrease in tumor volume. The results show the possibility to use [18F]FLT and [18F]FDG to image treatment effect early following treatment with APO866 in future clinical studies.
Conflict of interest statement
Figures
Similar articles
-
Early detection of response to experimental chemotherapeutic Top216 with [18F]FLT and [18F]FDG PET in human ovary cancer xenografts in mice.PLoS One. 2010 Sep 24;5(9):e12965. doi: 10.1371/journal.pone.0012965. PLoS One. 2010. PMID: 20885974 Free PMC article.
-
[18F]FLT PET for non-invasive assessment of tumor sensitivity to chemotherapy: studies with experimental chemotherapy TP202377 in human cancer xenografts in mice.PLoS One. 2012;7(11):e50618. doi: 10.1371/journal.pone.0050618. Epub 2012 Nov 30. PLoS One. 2012. PMID: 23226334 Free PMC article.
-
[18F]FDG and [18F]FLT positron emission tomography imaging following treatment with belinostat in human ovary cancer xenografts in mice.BMC Cancer. 2013 Apr 1;13:168. doi: 10.1186/1471-2407-13-168. BMC Cancer. 2013. PMID: 23548101 Free PMC article.
-
18F-FDG and 18F-FLT-PET imaging for monitoring everolimus effect on tumor-growth in neuroendocrine tumors: studies in human tumor xenografts in mice.PLoS One. 2014 Mar 13;9(3):e91387. doi: 10.1371/journal.pone.0091387. eCollection 2014. PLoS One. 2014. PMID: 24626055 Free PMC article.
-
Metabolic Imaging to Assess Treatment Response to Cytotoxic and Cytostatic Agents.Front Oncol. 2016 Jul 15;6:152. doi: 10.3389/fonc.2016.00152. eCollection 2016. Front Oncol. 2016. PMID: 27471678 Free PMC article. Review.
Cited by
-
Targeting the NAD+ salvage pathway suppresses APC mutation-driven colorectal cancer growth and Wnt/β-catenin signaling via increasing Axin level.Cell Commun Signal. 2020 Jan 31;18(1):16. doi: 10.1186/s12964-020-0513-5. Cell Commun Signal. 2020. PMID: 32005247 Free PMC article.
-
Emerging Radiopharmaceuticals Beyond FDG for Ovarian Cancer: A Review of Advances in Nuclear Medicine.Cancer Med. 2025 Sep;14(17):e71167. doi: 10.1002/cam4.71167. Cancer Med. 2025. PMID: 40923371 Free PMC article. Review.
-
Antitumor effect of combined NAMPT and CD73 inhibition in an ovarian cancer model.Oncotarget. 2016 Jan 19;7(3):2968-84. doi: 10.18632/oncotarget.6502. Oncotarget. 2016. PMID: 26658104 Free PMC article.
-
NAMPT inhibition sensitizes pancreatic adenocarcinoma cells to tumor-selective, PAR-independent metabolic catastrophe and cell death induced by β-lapachone.Cell Death Dis. 2015 Jan 15;6(1):e1599. doi: 10.1038/cddis.2014.564. Cell Death Dis. 2015. PMID: 25590809 Free PMC article.
-
Monitoring of anti-cancer treatment with (18)F-FDG and (18)F-FLT PET: a comprehensive review of pre-clinical studies.Am J Nucl Med Mol Imaging. 2015 Oct 12;5(5):431-56. eCollection 2015. Am J Nucl Med Mol Imaging. 2015. PMID: 26550536 Free PMC article. Review.
References
-
- Shields AF Grierson JR Dohmen BM Machulla HJ Stayanoff JC, et al. (1998) Imaging proliferation in vivo with [F-18]FLT and positron emission tomography. Nat Med 4: 1334–6. - PubMed
-
- Kong XB, Zhu QY, Vidal PM, Watanabe KA, Polsky B, et al. (1992) Comparisons of anti-human immunodeficiency virus activities, cellular transport, and plasma and intracellular pharmacokinetics of 3′-fluoro-3′-deoxythymidine and 3′-azido-3′-deoxythymidine. Antimicrob Agents Chemother 36: 808–18. - PMC - PubMed
-
- Arner ES, Eriksson S (1995) Mammalian deoxyribonucleoside kinases. Pharmacol Ther 67: 155–86. - PubMed
-
- Sherley JL, Kelly TJ (1988) Regulation of human thymidine kinase during the cell cycle. J Biol Chem 263: 8350–8. - PubMed
-
- Rasey JS, Grierson JR, Wiens LW, Kolb PD, Schwartz JL (2002) Validation of FLT uptake as a measure of thymidine kinase-1 activity in A549 carcinoma cells. J Nucl Med 43: 1210–7. - PubMed
Publication types
MeSH terms
Substances
LinkOut - more resources
Full Text Sources
Other Literature Sources
Medical
Miscellaneous
