. 2013;8(1):e53467.
doi: 10.1371/journal.pone.0053467. Epub 2013 Jan 7.

Fine mapping links the FTa1 flowering time regulator to the dominant spring1 locus in Medicago

Affiliations

Fine mapping links the FTa1 flowering time regulator to the dominant spring1 locus in Medicago

Chin Chin Yeoh et al. PLoS One. 2013.

Abstract

To extend our understanding of flowering time control in eudicots, we screened for mutants in the model legume Medicago truncatula (Medicago). We identified an early flowering mutant, spring1, in a T-DNA mutant screen, but spring1 was not tagged and was deemed a somaclonal mutant. We backcrossed the mutant to wild type R108. The F1 plants and the majority of F2 plants were early flowering like spring1, strongly indicating that spring1 conferred monogenic, dominant early flowering. We hypothesized that the spring1 phenotype resulted from over expression of an activator of flowering. Previously, a major QTL for flowering time in different Medicago accessions was located to an interval on chromosome 7 with six candidate flowering-time activators, including a CONSTANS gene, MtCO, and three FLOWERING LOCUS T (FT) genes. Hence we embarked upon linkage mapping using 29 markers from the MtCO/FT region on chromosome 7 on two populations developed by crossing spring1 with Jester. Spring1 mapped to an interval of ∼0.5 Mb on chromosome 7 that excluded MtCO, but contained 78 genes, including the three FT genes. Of these FT genes, only FTa1 was up-regulated in spring1 plants. We then investigated global gene expression in spring1 and R108 by microarray analysis. Overall, they had highly similar gene expression and apart from FTa1, no genes in the mapping interval were differentially expressed. Two MADS transcription factor genes, FRUITFULLb (FULb) and SUPPRESSOR OF OVER EXPRESSION OF CONSTANS1a (SOC1a), that were up-regulated in spring1, were also up-regulated in transgenic Medicago over-expressing FTa1. This suggested that their differential expression in spring1 resulted from the increased abundance of FTa1. A 6255 bp genomic FTa1 fragment, including the complete 5' region, was sequenced, but no changes were observed indicating that the spring1 mutation is not a DNA sequence difference in the FTa1 promoter or introns.


Conflict of interest statement

Competing Interests: The authors have declared that no competing interests exist.

Figures

Figure 1
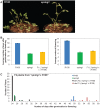
Figure 1. Flowering time of plants from the Backcross “spring1 x R108”.
Spring1, an early flowering mutant, was backcrossed with wild type R108 plants and the F1 and F2 progeny were grown in long day conditions and scored for flowering time. a) Photographs of R108 wild type plant and the spring1 mutant plants. Both plants were photographed 30 days after germination. b) Flowering time of the F1 progeny (n = 27) compared to spring1 (n = 12) and R108 (n = 12). The F1 plants flowered much more rapidly than R108 and at a similar time to spring1. Similar results were obtained when flowering time was scored using either of two methods; the number of days after germination to flowering, or the number of nodes on the primary axis at flowering. c) Distribution of the flowering time of the F2 progeny compared to spring1 and R108. The F2 population segregated 62 early flowering and 16 late flowering plants, as scored by days after germination to flowering, and by comparison to the parental lines, indicating that spring1 was a monogenic dominant mutation.
Figure 2
Figure 2. Flowering time of plants from “spring1 x Jester” and from “R108 x Jester”.
Spring1, an early flowering mutant in the R108 accession was crossed with Jester plants and the F1 and F2 progeny were grown in long day conditions and scored for flowering time (Table 1). A Control cross “R108 x Jester” was also performed. a) Flowering time of the F1 progeny from the Backcross “spring1 x Jester” (n = 32) and from the Control cross “R108 x Jester” (n = 12) was compared to spring1 (n = 12), Jester (n = 6) and R108 (n = 12). Flowering time was scored using two methods; the number of days after germination to flowering, or the number of nodes on the primary axis at flowering. The F1 plants from the Mapping cross flowered much more rapidly than the F1 plants from the Control cross by either measure, indicating that spring1 confers dominant early flowering in crosses to Jester. b) Distribution of the flowering time of the F2 progeny from the Mapping cross and the Control cross compared to parental lines. Plants that were scored as “unclassified” or died young are not included. The F2 population from “spring1 x Jester” segregated 421 early flowering and 57 late flowering plants as scored by nodes at flowering. The class with ≥11 nodes includes plants that had up to 25 nodes, but had not flowered by the time scoring was terminated at 87 days. The Control cross produced only late flowering F2 plants, with some having up to 19 nodes, but not having flowered by the time scoring was terminated at 65 days. c) Photographs of F2 plants from the “spring1 x Jester” Mapping cross; a typical early flowering plant with flowers (left), plants that have not flowered that are either very small, pale and slow growing, or small with an altered morphology (middle), and a typical late flowering plant (right). All plants were photographed at 26 days old.
Figure 3
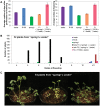
Figure 3. Flowering time of plants from the Test cross.
Spring1, an early flowering mutant, was crossed with Jester plants and the resulting F1 plants were then crossed with Jester in the Testcross (♂(♂“spring1 x ♀Jester”) x ♀Jester). The Testcross progeny were grown in long day conditions and scored for flowering time. Graph showing the distribution of flowering time of plants that were classified as early flowering (n = 83) and late flowering (n = 95) compared with Jester (n = 6) and F1 plants (n = 32). The class with ≥11 nodes includes plants that had up to 21 nodes, but had not flowered by the time scoring was terminated at 69 days after germination. Plants that were “unclassified” or died young are not included. As parental and progeny plants grew at different rates, flowering was measured as the node number on the main axis at flowering.
Figure 4
Figure 4. Markers for fine mapping spring1 on chromosome 7 and defining the ∼0.5 Mb interval that contains spring1.
a) Physical map of the spring1 region on chromosome 7 with DNA sequence in kilobases (kb), Bacterial Artificial Chromosome (BAC) clone contigs (grey bars) and mapping marker position (red dots). Markers defining the spring1 interval are blue. Four columns show the numbers of recombinants detected with the markers in the early and late flowering plants from the two Jester mapping populations; the F2 plants from cross “spring1 x Jester” and the progeny of the Test cross. b) Examples of PCR genotyping using two indel DNA markers flanking the spring1 interval. Control PCR reactions from Jester (Jest), R108 and F1 from the control cross (“R108 x Jester”) are shown. R108 and spring1 gave the same PCR products in all cases. PCR genotyping with marker Medtr7g084090.1 (left). Products from genotyping of three early flowering F2 plants (E1 to E3) from the Mapping cross “spring1xJester”. Plant E1 is homozygous for the Jester band, thus Medtr7g084090.1 is separated from spring1 by a recombination event. Genotyping with marker Medtr7g085190.1 on six late flowering F2 plants (L1 to L6) from the Mapping cross “spring1xJester” (right). Plant L1 is heterozygous, thus Medtr7g085190.1 is separated from spring1 by a recombination event. A feature of both indel markers is the F1 plants and the heterozygous plants give three bands after PCR. These are the expected Jester and R108 bands and a third larger band which is likely to be a heteroduplex of the two PCR differently-sized fragments that is slightly retarded during gel electrophoresis compared to the other bands. PCR products were separated by electrophoresis on a 3% agarose gel and photographed. The Invitrogen 1 kb+ ladder provided molecular size standards. Physical maps were redrawn from a Chromosome Visualisation Tool (CViT) BLAST search http://medicagohapmap.org/with the marker sequences against the current Medicago pseudomolecule Mt3.5 genome assembly http://blast.jcvi.org/er-blast/index.cgi?project=mtbe.
Figure 5
Figure 5. FTa1 is up-regulated in spring1 plants.
Accumulation of FTa1 and FTa2 transcript in spring1 and R108 in long day conditions was measured using qRT-PCR on 12–14 day old seedlings with two trifoliate leaves.Relative transcript abundance of FTa1 (a) and FTa2 (b), over a diurnal timecourse in the aerial parts of seedlings. Levels were normalised to TUBULIN (TUB) and calibrated relative to the expression of FTa1 (second biological rep) at Zeitgeber 20 (ZT0 is the time of lights on). The mean +/− SE of 2 biological replicates is shown for the spring1 samples. For R108, the two cDNA samples from each biological replicate were pooled and the mean +/− SE of the 3 technical replicates are presented. c) Accumulation of FTa1 transcript in the first trifoliate leaf of homozygous (after two backcrosses to R108) and heterozygous spring1 plants (F1 plants from a backcross to R108) with levels normalised to PROTODERMAL FACTOR 2 (PDF2). The mean +/− SE of 3 biological replicates is shown.
Figure 6
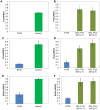
Figure 6. FULb and SOC1a are up-regulated in spring1 and in transgenic Medicago plants over expressing FTa1.
Accumulation of FTa1, FULb and SOC1a in spring1, 35S::FTa1 transgenic Medicago plants and R108 in long daylength conditions was measured using qRT-PCR on the first trifoliate leaf from 12–14 day old seedlings. The mean +/− SE of 3 biological replicates is shown relative to PDF2. Relative transcript abundance of FTa1 (a), FULb (c) and SOC1a (e) in spring1. Relative transcript abundance of FTa1 (b), FULb (d) and SOC1a (f) in 35S::FTa1 lines.

Similar articles

Cited by

References

    1. Putterill J, Laurie R, Macknight R (2004) It´s time to flower: the genetic control of flowering time. BioEssays 26: 363–373. - PubMed
    1. Amasino RM, Michaels SD (2010) The Timing of Flowering. Plant Physiology 154: 516–520. - PMC - PubMed
    1. Turck F, Fornara F, Coupland G (2008) Regulation and identity of florigen: FLOWERING LOCUS T moves center stage. Annual Review of Plant Biology 59: 573–594. - PubMed
    1. Turnbull C (2011) Long-distance regulation of flowering time. Journal of Experimental Botany 62: 4399–4413. - PubMed
    1. Shalit A, Rozman A, Goldshmidt A, Alvarez JP, Bowman JL, et al. (2009) The flowering hormone florigen functions as a general systemic regulator of growth and termination. Proceedings of the National Academy of Sciences of the United States of America 106: 8392–8397. - PMC - PubMed

Publication types