. 2013;8(1):e53546.
doi: 10.1371/journal.pone.0053546. Epub 2013 Jan 7.

A specialized microvascular domain in the mouse neural stem cell niche

Affiliations

A specialized microvascular domain in the mouse neural stem cell niche

James C Culver et al. PLoS One. 2013.

Abstract

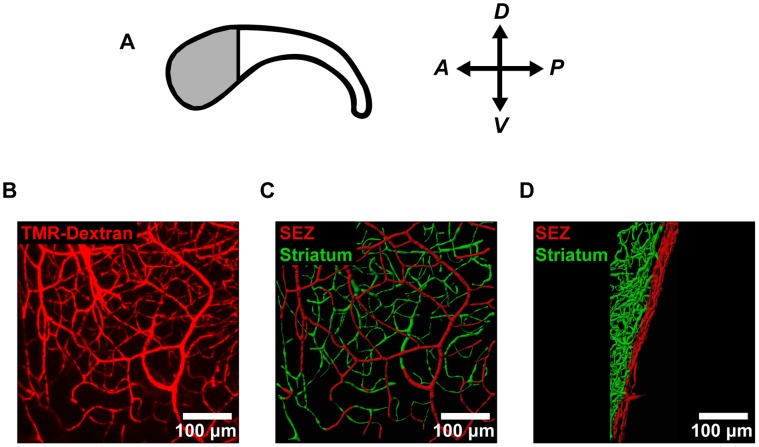
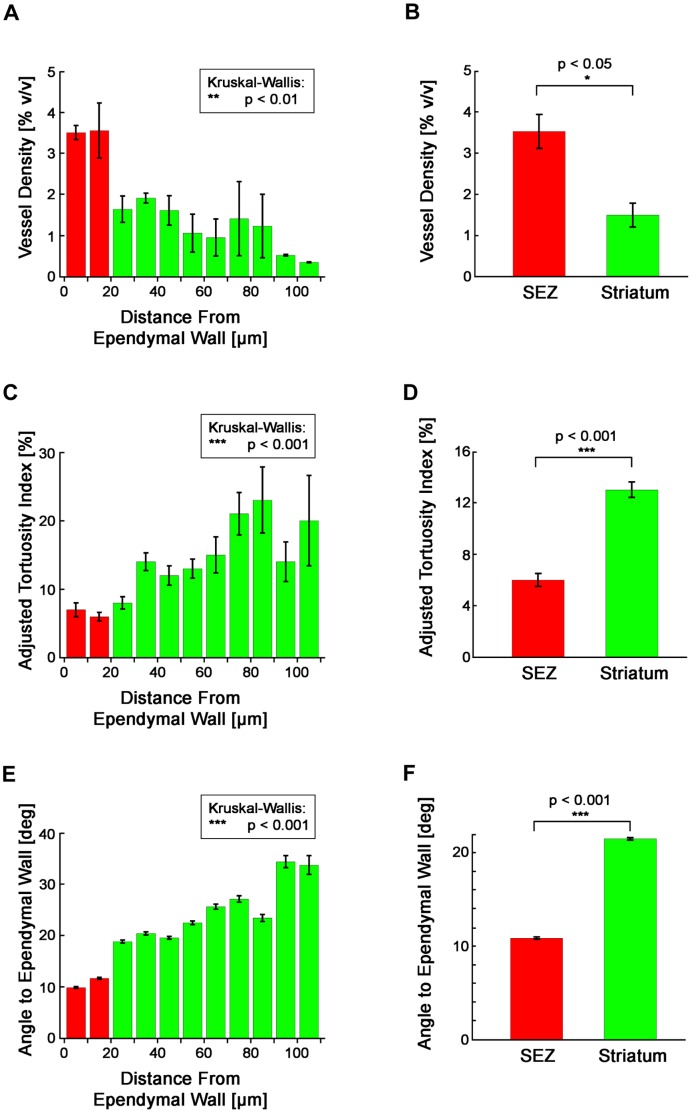
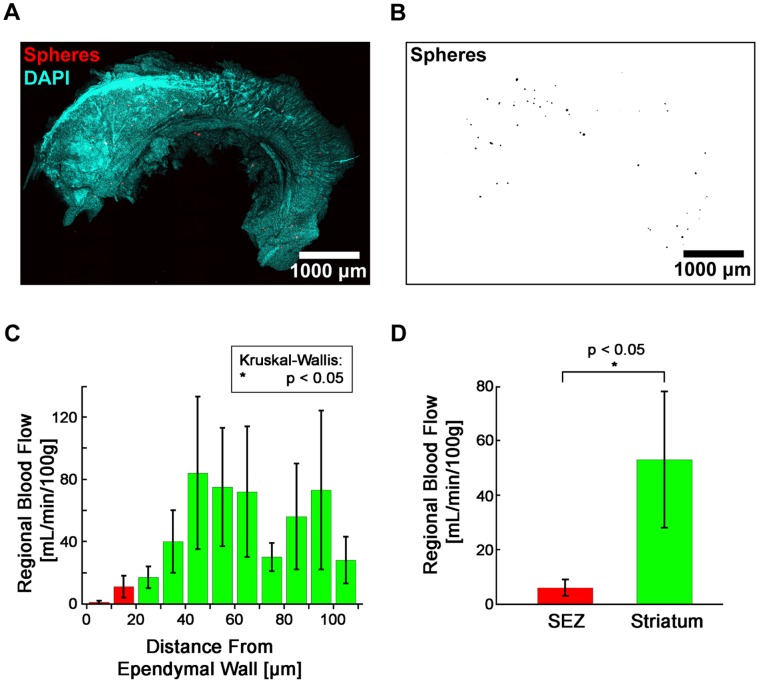
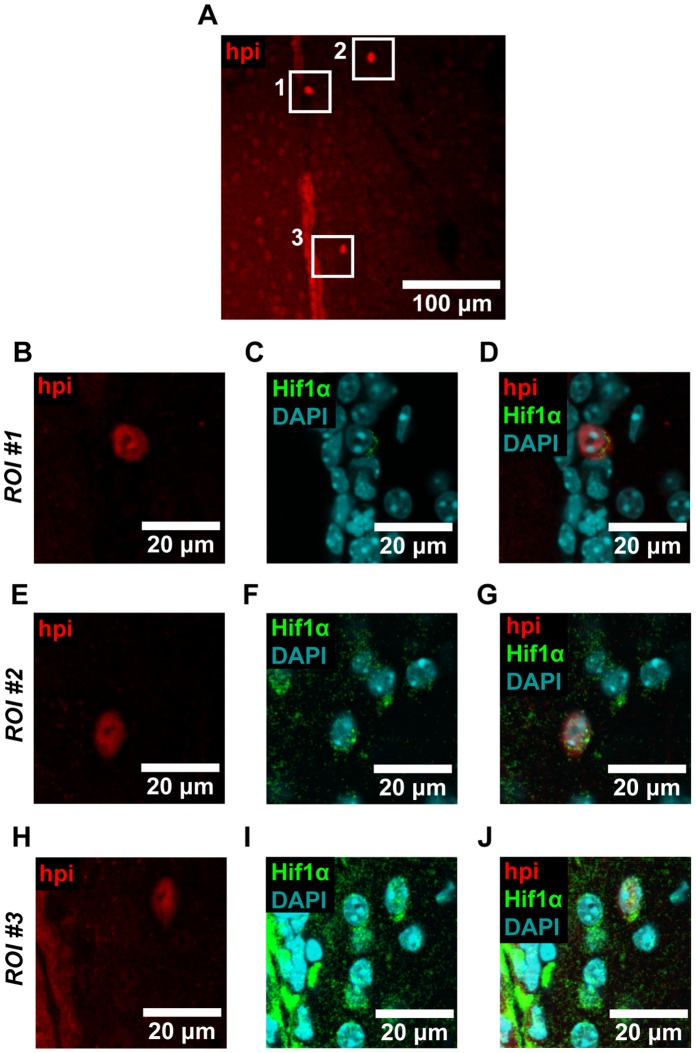
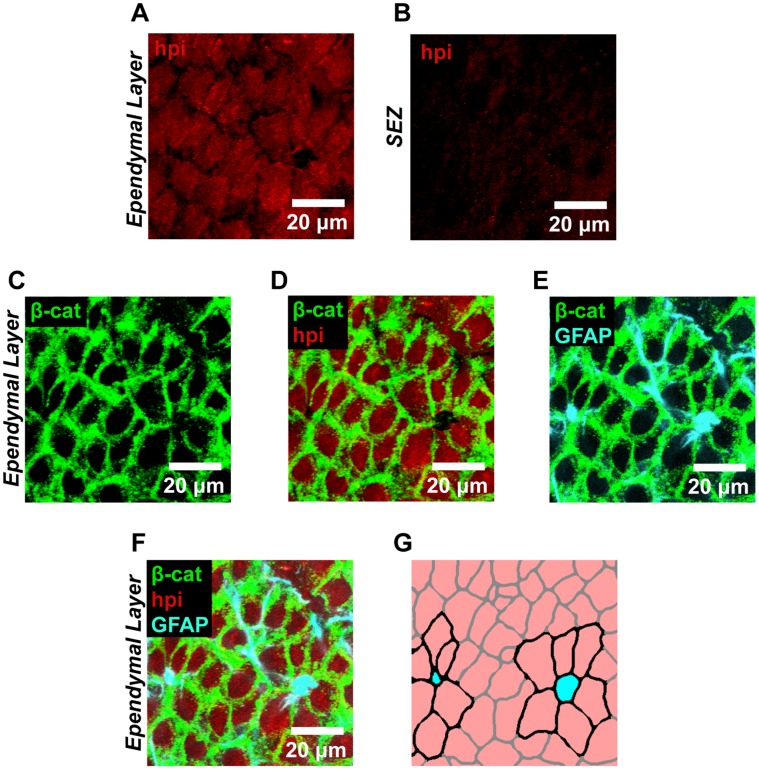
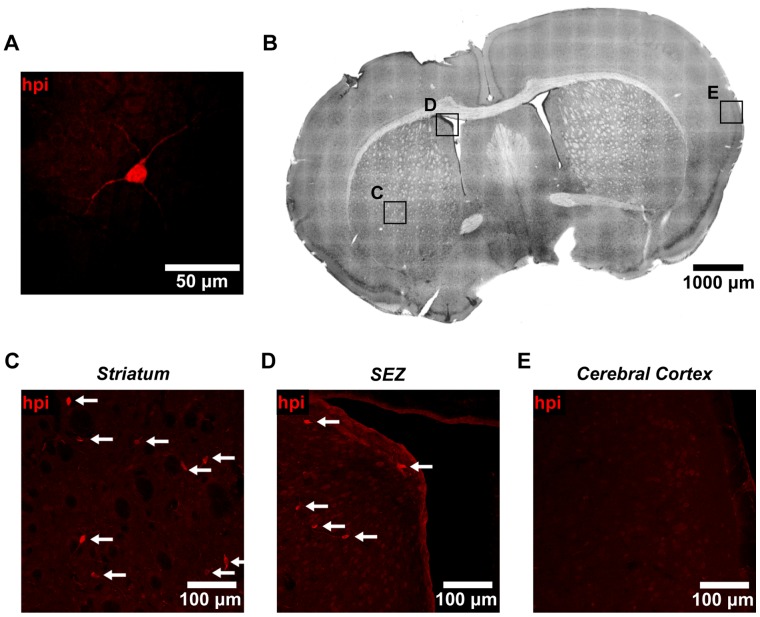
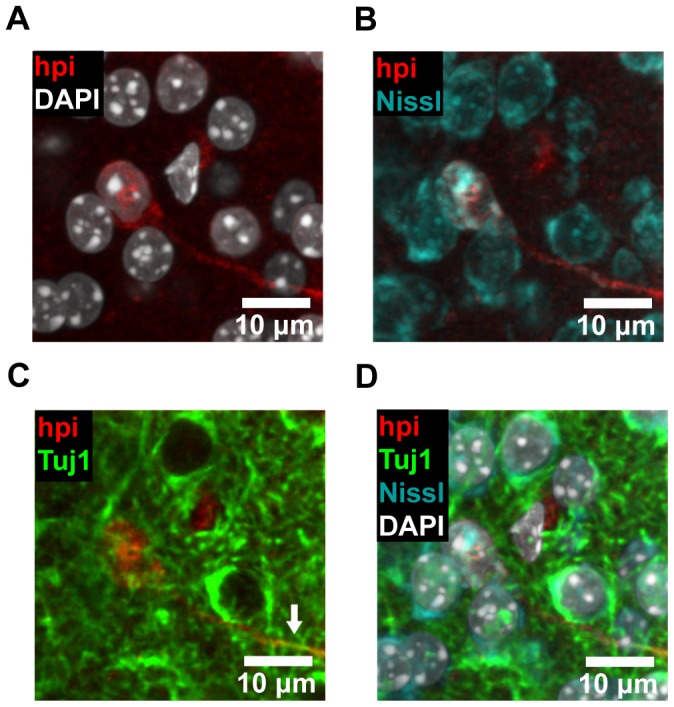
The microenvironment of the subependymal zone (SEZ) neural stem cell niche is necessary for regulating adult neurogenesis. In particular, signaling from the microvasculature is essential for adult neural stem cell maintenance, but microvascular structure and blood flow dynamics in the SEZ are not well understood. In this work, we show that the mouse SEZ constitutes a specialized microvascular domain defined by unique vessel architecture and reduced rates of blood flow. Additionally, we demonstrate that hypoxic conditions are detectable in the ependymal layer that lines the ventricle, and in a subpopulation of neurons throughout the SEZ and striatum. Together, these data highlight previously unidentified features of the SEZ neural stem cell niche, and further demonstrate the extent of microvascular specialization in the SEZ microenvironment.


Conflict of interest statement

Competing Interests: The authors have declared that no competing interests exist.

Figures

Figure 1
Figure 1. Confocal imaging reveals microvascular architecture in SEZ flatmounts.
(A) For analysis of vessel structure in the neural stem cell niche, we focused on the anterior region of the SEZ (shaded region) where the density of neural stem cells is highest. (B) The microvessels in the anterior SEZ were labeled with an intracardial injection of fluorescent tetramethylrhodamine-labeled dextran (TMR-Dextran) and imaged en-face. (C–D) Vessel segments were traced using image processing software and color-coded according to distance from the ependymal wall (SEZ  = 0−20 µm; striatum >20 µm). Vessels are shown both en-face (C) and from the side (D).
Figure 2
Figure 2. Vessels in the anterior SEZ and striatum are morphologically distinct.
(A) Mean vessel density is not equal at all depths (p<0.01, Kruskal-Wallis test). (B) Mean vessel density in the SEZ is significantly different from the mean density in the striatum (p<0.05, Wilcoxon Rank Sum test; nmice = 5, nobservations,SEZ = 5, nobservations,Str = 5). (C) Mean vessel tortuosity is not equal at all depths (p<0.001, Kruskal-Wallis test). (D) Mean vessel tortuosity in the SEZ is significantly different from the mean tortuosity in the striatum (p<0.001, Wilcoxon Rank Sum test; nmice = 5, nobservations,SEZ = 395, nobservations,Str = 904). (E) The mean angle of the ependymal wall to vessels is not equal at all depths (p<0.001, Kruskal-Wallis test). (F) The mean angle of the ependymal wall to vessels in the SEZ is significantly different from the mean angle in the striatum (p<0.001, Wilcoxon Rank Sum test; nmice = 5, nobservations,SEZ = 10,988, nobservations,Str = 20,159). (A–F) Plotted values represent mean ± standard error.
Figure 3
Figure 3. Regional blood flow in the SEZ is significantly less than in the striatum. (A–B
) Deposited microspheres were imaged in SEZ flatmounts for measuring regional blood flow. DAPI (A) was used to locate the surface of the ependymal wall for determining microsphere depths. (C) Mean blood flow is not equal at all depths (p<0.05, Kruskal-Wallis test). (D) Mean blood flow in the SEZ is significantly different from the mean blood flow in the striatum (p<0.05, Wilcoxon Rank Sum test; nmice = 4, nobservations,SEZ = 8, nobservations,Str = 8). (C–D) Plotted values represent mean ± standard error.
Figure 4
Figure 4. The neural stem cell niche exhibits functional hypoxia.
(A–B) In mice treated with Hypoxyprobe-1 (hpi), hypoxia was detected in SEZ flatmounts throughout the ependymal cell layer (A). Bright Hypoxyprobe-1 staining was also detected in a subpopulation of cells immediately beneath the ependymal wall. Tissue treated with vehicle only (B) revealed minimal background staining, indicating that the staining seen in (A) is antigen specific. Immunostaining protocols and imaging settings were kept constant for (A) and (B). Representative images are shown. (C–D) In mice treated with Hypoxyprobe-1, hypoxia was also detected in the ependymal cell layer in coronal brain sections (C). Bright Hypoxyprobe-1 staining was detected in a distinct subpopulation of cells that was visible in the SEZ and striatum as well. Tissue treated with vehicle only (D) revealed minimal background staining, indicating that the staining seen in (C) is antigen specific. Immunostaining protocols and imaging settings were kept constant for (C) and (D). Representative images are shown.
Figure 5
Figure 5. Hypoxyprobe-1 staining colocalizes with Hif1α.
(A) Coronal brain sections were imaged, and regions of interest (ROIs) where Hypoxyprobe-1 (hpi) staining was observed were selected for closer inspection. (B–J) We observed colocalization between Hypoxyprobe-1 and Hif1α in each of the three ROIs shown, and in cells located in the SEZ, striatum, and ependymal layer. Overall, we observed colocalization with Hif1α in 83% of the cells that exhibited bright Hypoxyprobe-1 staining (ncells  = 18). Image data were processed with a Gaussian filter. Representative images are shown.
Figure 6
Figure 6. The ependymal cell layer in the SEZ is functionally hypoxic.
(A–B) High magnification views of the ependymal cell layer (A) and underlying SEZ (B) confirmed that Hypoxyprobe-1 (hpi) staining was specific to the ependymal layer and not to the underlying tissue. (C–D) This observation was further verified by staining for β-catenin (C), which labels the cell boundaries of ependymal cells. Dual labeling (D) revealed that the ependymal cells did indeed exhibit Hypoxyprobe-1 staining. (E–G) Staining for GFAP (E) further confirmed this region as the neural stem cell niche by identifying neural stem cells within the ependymal wall that were arranged in a previously described pinwheel formation. Triple labeling revealed the presence of functional hypoxia throughout the neighboring ependymal cells (F). This is diagrammed in (G) where neural stem cells are shown in cyan, Hypoxyprobe-1 positive ependymal cells are shown in pink, and pinwheel structures are highlighted with cell borders drawn in black. (A–F) Linear unmixing was implemented to eliminate spectral overlap between fluorochromes. Representative images are shown.
Figure 7
Figure 7. A subpopulation of non-ependymal cells in the SEZ and striatum exhibits functional hypoxia.
(A) Non-ependymal cells staining brightly for Hypoxyprobe-1 (hpi) were characterized by large cell bodies and long dendrite-like processes. (B) Coronal brain sections were imaged to search for these hypoxic cells in various brain regions. Insets, shown at higher magnification in (C–E), are representative of the striatum (C), SEZ (D), and cerebral cortex (E). All insets were imaged using the same settings. (C) Cells staining brightly for Hypoxyprobe-1 (arrows) were observed in coronal sections of the striatum. Cells were always found in isolation, and never in clusters. (D) Non-ependymal cells staining brightly for Hypoxyprobe-1 (arrows) were also observed in coronal sections of the SEZ. Cells were always found in isolation, and never in clusters. (E) In comparison, cells staining brightly for Hypoxyprobe-1 were observed in the cerebral cortex only rarely.
Figure 8
Figure 8. Hypoxic cells in the SEZ and striatum express neuronal markers.
(A–D) Coronal brain slices were stained with Hypoxyprobe-1 (hpi) and neuronal markers. Hypoxyprobe-1 staining (A) was observed to colocalize with Nissl staining (B), a classic neuronal marker. The dendritic processes of cells positive for Hypoxyprobe-1 were also observed to express Tuj1 (β-tubulin-III), another neuronal marker (C, arrow). The merged image reveals the colocalization of all these markers (D). Image data were processed with a Gaussian filter. Representative images are shown.

Similar articles

Cited by

References

    1. Eriksson PS, Perfilieva E, Bjork-Eriksson T, Alborn AM, Nordborg C, et al. (1998) Neurogenesis in the adult human hippocampus. Nat Med 4: 1313–1317. - PubMed
    1. Doetsch F, Caille I, Lim DA, Garcia-Verdugo JM, Alvarez-Buylla A (1999) Subventricular zone astrocytes are neural stem cells in the adult mammalian brain. Cell 97: 703–716. - PubMed
    1. Palmer TD, Willhoite AR, Gage FH (2000) Vascular niche for adult hippocampal neurogenesis. J Comp Neurol 425: 479–494. - PubMed
    1. Shen Q, Wang Y, Kokovay E, Lin G, Chuang SM, et al. (2008) Adult SVZ stem cells lie in a vascular niche: a quantitative analysis of niche cell-cell interactions. Cell Stem Cell 3: 289–300. - PMC - PubMed
    1. Rakic P (2003) Elusive radial glial cells: historical and evolutionary perspective. Glia 43: 19–32. - PubMed

Publication types

MeSH terms

LinkOut - more resources