. 2013;8(1):e53594.
doi: 10.1371/journal.pone.0053594. Epub 2013 Jan 7.

A global transcriptome analysis reveals molecular hallmarks of neural stem cell death, survival, and differentiation in response to partial FGF-2 and EGF deprivation

Affiliations

A global transcriptome analysis reveals molecular hallmarks of neural stem cell death, survival, and differentiation in response to partial FGF-2 and EGF deprivation

Vanesa Nieto-Estévez et al. PLoS One. 2013.

Abstract

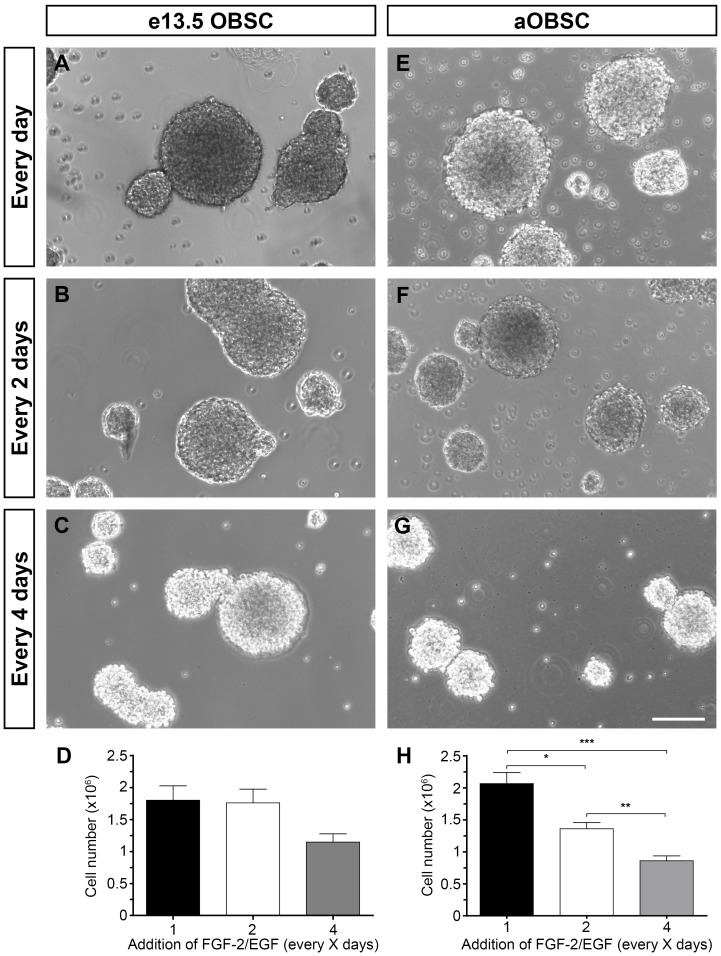
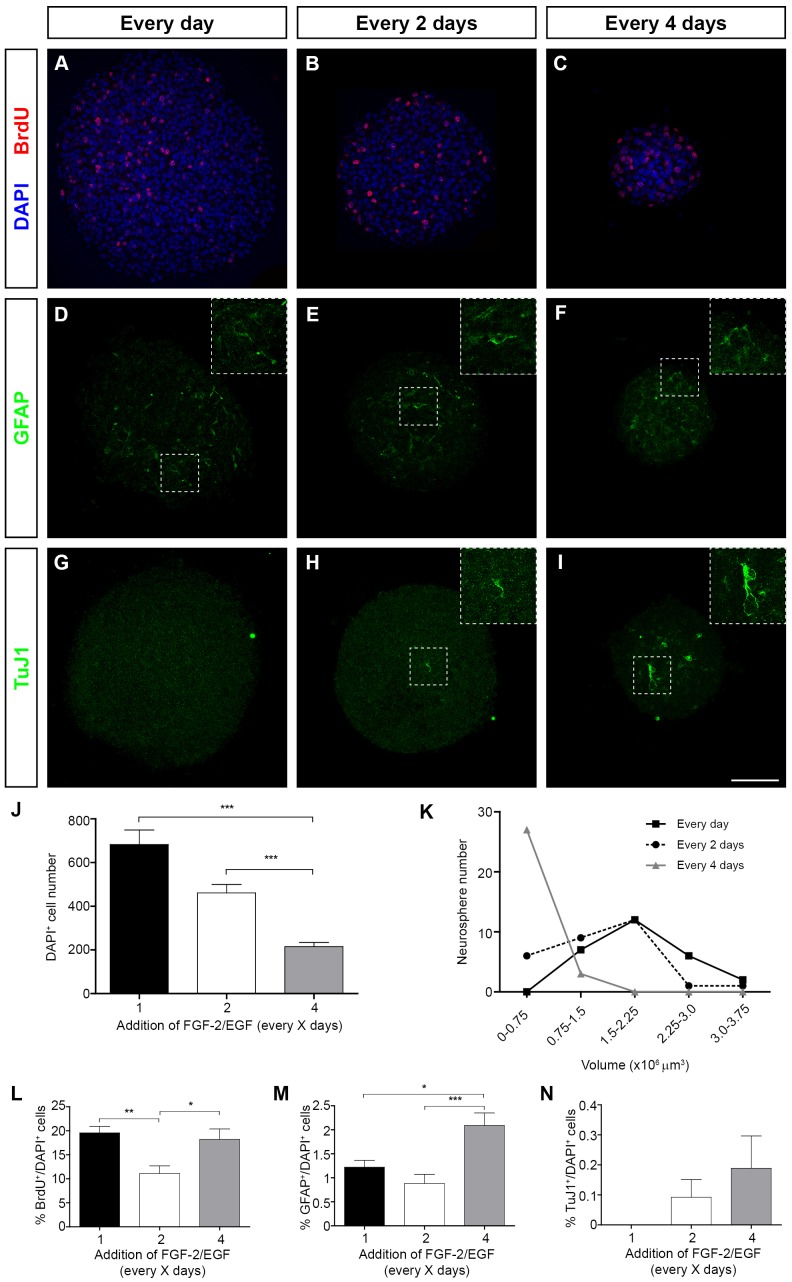
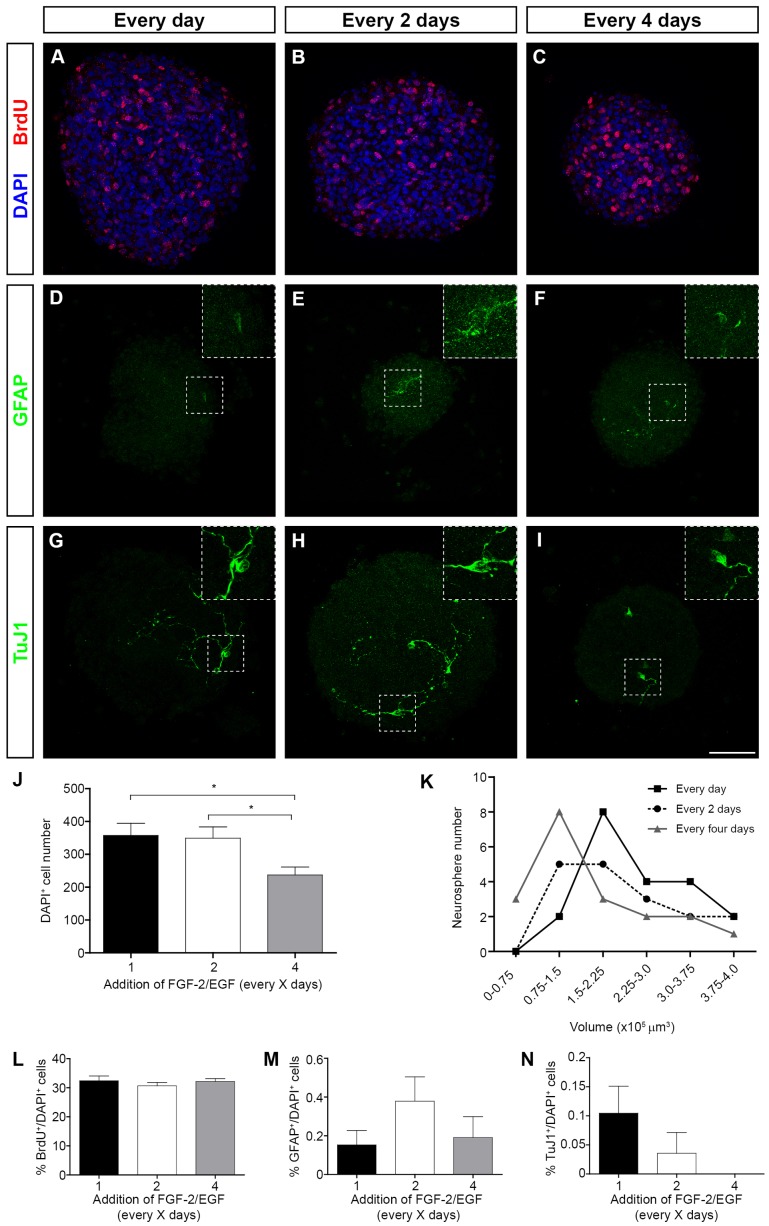
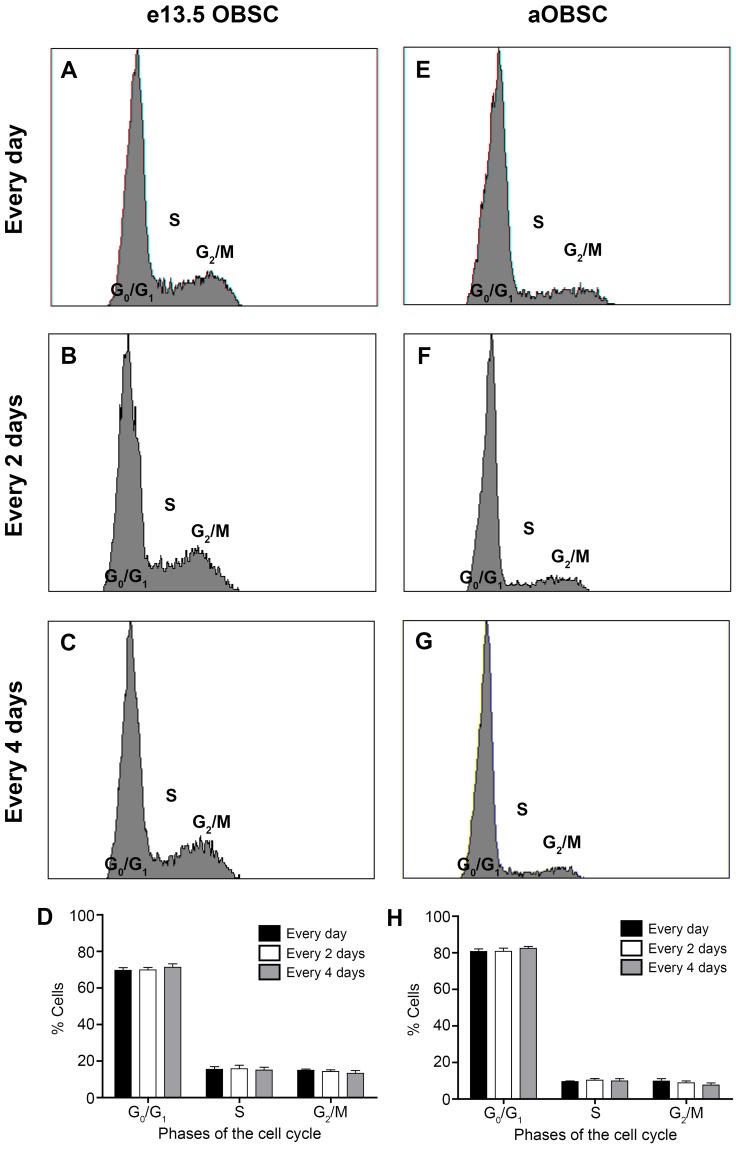
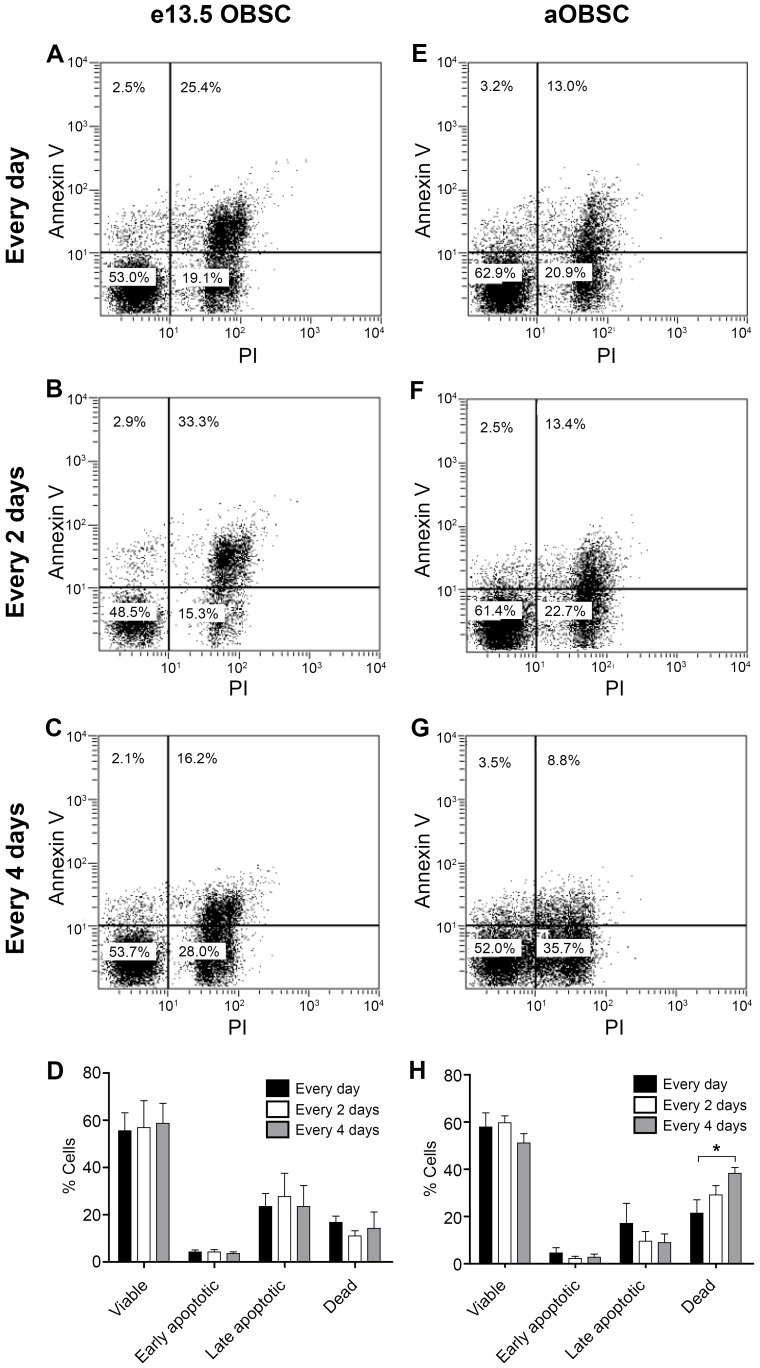
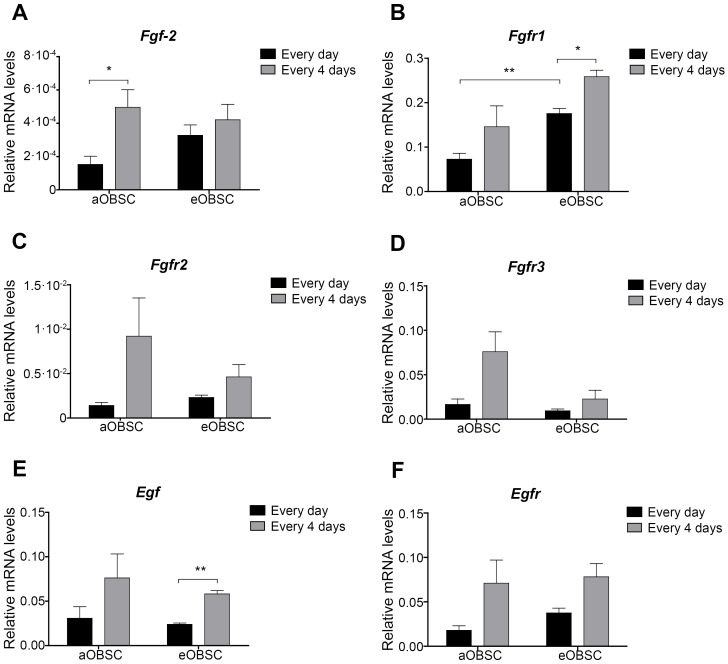
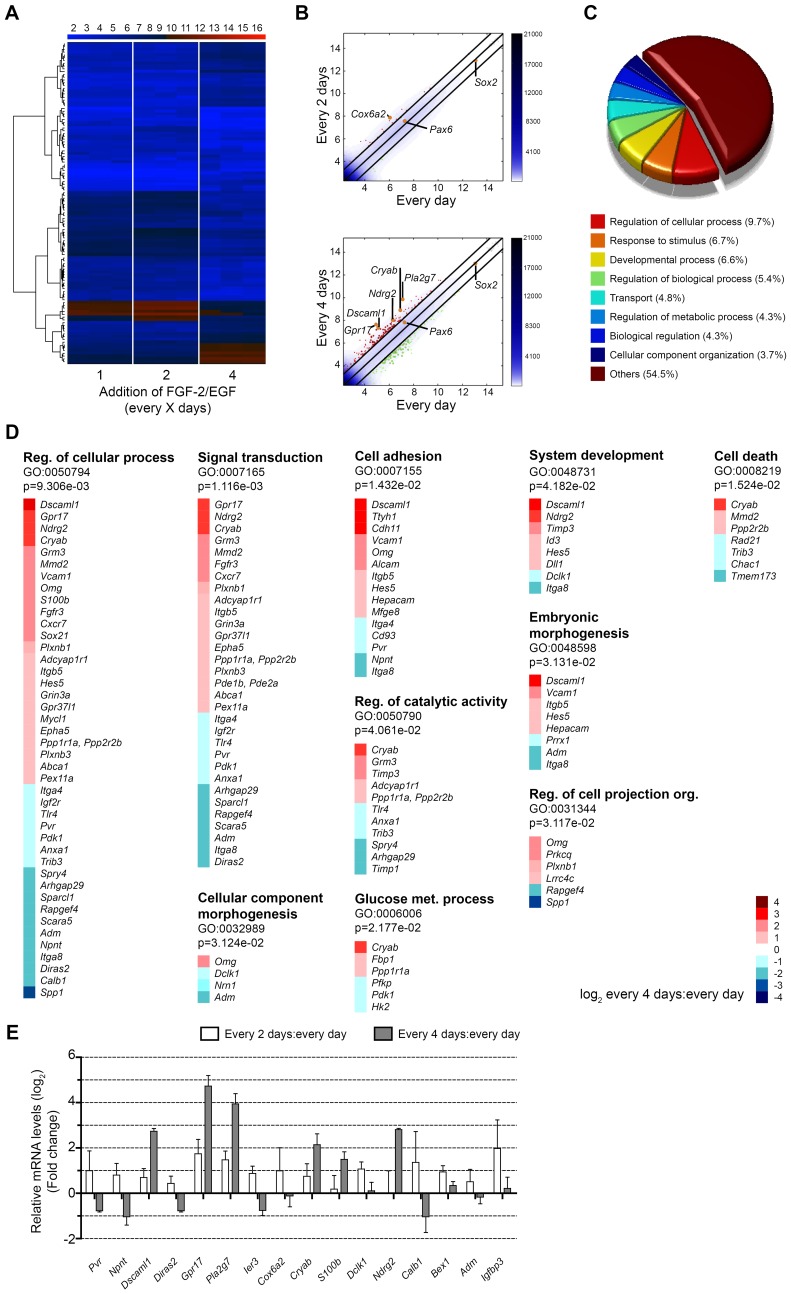
Neurosphere cell culture is a commonly used model to study the properties and potential applications of neural stem cells (NSCs). However, standard protocols to culture NSCs have yet to be established, and the mechanisms underlying NSC survival and maintenance of their undifferentiated state, in response to the growth factors FGF-2 and EGF are not fully understood. Using cultures of embryonic and adult olfactory bulb stem cells (eOBSCs and aOBSCs), we analyzed the consequences of FGF-2 and EGF addition at different intervals on proliferation, cell cycle progression, cell death and differentiation, as well as on global gene expression. As opposed to cultures supplemented daily, addition of FGF-2 and EGF every 4 days significantly reduced the neurosphere volume and the total number of cells in the spheres, mainly due to increased cell death. Moreover, partial FGF-2 and EGF deprivation produced an increase in OBSC differentiation during the proliferative phase. These changes were more evident in aOBSC than eOBSC cultures. Remarkably, these effects were accompanied by a significant upregulation in the expression of endogenous Fgf-2 and genes involved in cell death and survival (Cryab), lipid catabolic processes (Pla2g7), cell adhesion (Dscaml1), cell differentiation (Dscaml1, Gpr17, S100b, Ndrg2) and signal transduction (Gpr17, Ndrg2). These findings support that a daily supply of FGF-2 and EGF is critical to maintain the viability and the undifferentiated state of NSCs in culture, and they reveal novel molecular hallmarks of NSC death, survival and the initiation of differentiation.


Conflict of interest statement

Competing Interests: The authors have declared that no competing interests exist.

Figures

Figure 1
Figure 1. Growth of embryonic and adult OBSC neurospheres supplemented at different intervals with FGF-2 and EGF.
Embryonic OBSCs (A–D) and adult OBSCs (prepared from 4-, 6-, 7-, 12- and 15-month old mice; E–H) were grown as neurospheres, and FGF-2 and EGF (FGF-2/EGF) were added daily, every 2 days or every 4 days. On the day of passage (day 4 for embryonic and day 7 for adult OBSCs), the neurospheres were mechanically dissociated and the cell number was determined using the Trypan blue dye exclusion method. Images show representative E13.5 (A–C) and adult (E–G) neurospheres. The bar graphs show the average number of eOBSCs (D) and aOBSCs (H) in each condition. The results represent the mean ± SEM from 24-35 passages from 6 different cell cultures per condition. Decreasing the frequency of FGF-2/EGF addition reduced cell number and neurosphere size. *P<0.05, **P<0.01 and ***P<0.001 (Kruskal-Wallis test followed by post hoc analysis using Dunn´s multiple comparison test). The 36% reduction in eOBSC number in the C4 versus de Ctr condition (D) was statistically significant when the two average means were compared using the Student´s t test (P<0.01). Scale bars (G) = 121.02 µm.
Figure 2
Figure 2. The effect of growth factor addition on neurosphere size, proliferation and the expression of cell differentiation markers in aOBSC neurospheres.
The aOBSCs (prepared from 7- and 15-month old mice) were grown as neurospheres, to which FGF-2/EGF was added at different intervals. After 7 days in culture, BrdU (5 µM) was added for 30 minutes and the neurospheres were collected on matrigel, fixed and immunostained, and then stained with DAPI. Representative images of neurospheres grown in cultures supplemented with growth factors daily (A, D, G), every 2 days (B, E, H) and every 4 days (C, F, I), and immunostained with BrdU (A–C), GFAP (D–F) and TuJ1 (G–I). Bar graphs show the average number of DAPI+ cells per confocal plane of each neurosphere (J), and the percentage of BrdU+ (L), GFAP+ (M) and TuJ1+ cells (N). Line graphs show the distribution of neurosphere number versus volume (K). The results represent the mean ± SEM of 15–30 neurospheres from 2 different cell cultures. *P<0.05, **P<0.01 and ***P<0.001 (One way ANOVA followed by post hoc analysis using Bonferronís test). The 32% reduction in DAPI+ cell number in the C2 versus the Ctr condition (J) was statistically significant when the two average means were compared using the Student´s t test (P<0.01). Scale bars (I) = 77.51 µm and 39.0 µm (inserts).
Figure 3
Figure 3. The effect of growth factor addition on neurosphere size, proliferation and expression of cell differentiation markers in eOBSC neurospheres.
The eOBSCs were cultured and passaged as floating neurospheres as described in Fig. 1. After 4 days in culture, BrdU (5 µM) was added for 30 minutes and the neurospheres were collected on matrigel, immunostained and counterstained with DAPI. Images show the representative neurosphere growth in cultures to which factors were added daily (A, D, G), every 2 days (B, E, H) and every 4 days (C, F, I), and that were immunostained with BrdU (A–C), GFAP (D–F) and TuJ1 (G–I). Bar graphs show the number of DAPI+ cells (J), and the percentages of BrdU+ (L), GFAP+ (M) and TuJ1+ (N) cells. Line graphs show the distribution of neurosphere number versus volume (K). Results represent the mean ± SEM from 15–30 neurospheres in 2 experiments. *P<0.05 (One way ANOVA followed by post hoc analysis using Bonferronís test). Scale bars (I) = 77.51 µm, insert  = 39 µm.
Figure 4
Figure 4. The influence of the frequency of FGF-2/EGF addition on the OBSC cell cycle.
Embryonic OBSCs (A–D) and adult OBSCs (prepared from 7- and 15-month old mice; E–H) were grown as neurospheres as described in Fig. 1. After mechanical dissociation on days 4 (eOBSC) or 7 (aOBSCs), cells were fixed with ethanol, stained with PI and analyzed by flow cytometry. Graphs show the representative cell cycle profiles for eOBSC (A–C) and aOBSC (E–G) cultures, to which FGF-2/EGF was added daily (A, E), every 2 days (B, F) or every 4 days (C, G). The graphs show the percentage of cells in the different phases of the cell cycle (D, eOBSCs; H, aOBSCs). Results represent the mean ± SEM from 4 passages from 2 different cell cultures per condition. Under these conditions, the addition of growth factors at different intervals had no significant effect on the cell cycle parameters tested. However, aOBSC cultures contained more cells in G0/G1 (P<0.001) and fewer cells in S and G2/M (P<0.001) as compared with eOBSCs (two-tailed Student’s t-test with Welch´s correction).
Figure 5
Figure 5. Decrease in the frequency of FGF-2/EGF addition increases cell death in aOBSCs.
Embryonic (A–D) and adult (prepared from 7- and 15-month old mice; E–H) OBSCs were grown as neurospheres as described in Fig. 1. On days 4 (eOBSCs) or 7 (aOBSCs) the neurospheres were dissociated mechanically, and the cells were stained with PI and annexin V before they were analyzed by flow cytometry. Dot-plots show the percentage of viable, early and late apoptotic and dead cells in the cultures to which growth factors were added daily (A, E), every 2 days (B, F) or every 4 days (C, G). Graphs show the percentage of cells in each group (D, E13.5 OBSCs; H, aOBSCs). The results represent the mean ± SEM from 3–5 passages from 2 different cell cultures per condition. A decrease in the frequency of growth factor addition promoted significant cell death in aOBSCs but not in eOBSCs. *P<0.05 (One way ANOVA followed by post hoc analysis using Bonferronís test). PI = Propidium iodide.
Figure 6
Figure 6. Expression of Fgf-2, Egf and their receptors in aOBSCs and eOBSCs.
Embryonic OBSCs and adult OBSCs (prepared from 7- and 15-month old mice) were grown as neurospheres as described in Fig. 1. After mechanical dissociation on days 4 (eOBSC) or 7 (aOBSCs), mRNA was extracted from cells supplied with FGF-2/EGF every day (Ctr) and every 4 days (C4), and analyzed using real time RT-qPCR. The graphs show the relative mRNA levels of Fgf-2 (A), Fgfr1 (B), Fgfr2 (C), Fgfr3 (D), Egf (E) and Egfr (F) in Ctr and C4 cultures. aOBSCs partially starved of exogenous FGF-2/EGF expressed higher levels of endogenous Fgf-2 than controls. The results represent the mean ± SEM of 3 experiments. *P<0.05, **P<0.01 (two-tailed Student’s t-test).
Figure 7
Figure 7. RNA expression in aOBSCs reveals previously undescribed genes involved in NSC death, survival and the initiation of differentiation.
aOBSCs (prepared from 7- and 15-month old mice) were cultured and passaged as floating neurospheres as described in Fig. 1. The relative mRNA levels were analyzed using microarray and real time RT-qPCR techniques. (A) The heat map was generated using probes with a range of variation between samples of at least 2 and a FDR <0.01. The color bar at the top represents the gene expression in a log2 scale: the higher the gene expression level, the redder the color. (B) Pairwise scatter plots of the C2 (top) and C4 (lower) conditions relative to the Ctr condition. The black lines define the boundaries of the two-fold changes in gene expression between paired samples. Genes up-regulated in ordinate versus abscissas samples are shown in red circles, while down-regulated genes are shown in green. Orange dots indicate the positions of some key genes, including markers of NSCs (Sox2 and Pax6) and of upregulated genes (Cox6a2, Pla2g7, Cryab, Ndrg2, Dscaml1 and Gpr17). The color bar to the right indicates the scattering density, whereby the higher the scattering density, the darker the blue color. (C) The pie chart shows the frequency of GO terms in the “biological process” category. (D) GO enrichment analysis revealed up to 10 GO terms that were statistically enriched in C4 cultures when compared with the controls. (E) The graph shows the relative changes in the mRNA levels of selected transcripts expressed in C2 and C4 cultures when compared with controls, and as measured by real time RT-qPCR. The aOBSCs supplemented every 4 days with growth factors exhibited alterations in genes involved in cell death and survival (Cryab), lipid catabolic processes (Pla2g7), cell adhesion (Dscaml1), cell differentiation (Dscaml1, Gpr17, S100b, Ndrg2) and signal transduction (Gpr17, Ndrg2). The results represent the mean ± SEM of 3 experiments.
Figure 8
Figure 8. Maps of the KEGG significantly enriched pathways associated with genes upregulated in C4 versus control cultures.
The KEGG pathway enrichment analysis revealed two significantly enriched pathways with the following maps. (A) axon guidance (p = 6.274e-03; Dcc, Eph5a, Plxnb1, Plxnb3 and Srgap3); and (B) neuroactive ligand-receptor interaction (p = 1.834e−02; Adcyap1r1, Gabbr1, Grin3a, Grm3 and Lpar4). In each map the upregulated genes are depicted in red.

Similar articles

Cited by

References

    1. Lendahl U, Zimmerman LB, McKay RD (1990) CNS stem cells express a new class of intermediate filament protein. Cell 60: 585–595. - PubMed
    1. Lois C, Alvarez-Buylla A (1993) Proliferating subventricular zone cells in the adult mammalian forebrain can differentiate into neurons and glia. Proc Natl Acad Sci U S A 90: 2074–2077. - PMC - PubMed
    1. Malatesta P, Hartfuss E, Gotz M (2000) Isolation of radial glial cells by fluorescent-activated cell sorting reveals a neuronal lineage. Development 127: 5253–5263. - PubMed
    1. Noctor SC, Flint AC, Weissman TA, Dammerman RS, Kriegstein AR (2001) Neurons derived from radial glial cells establish radial units in neocortex. Nature 409: 714–720. - PubMed
    1. Kriegstein A, Alvarez-Buylla A (2009) The glial nature of embryonic and adult neural stem cells. Annu Rev Neurosci 32: 149–184. - PMC - PubMed

Publication types

MeSH terms

Associated data