. 2013 Apr;43(4):918-28.
doi: 10.1002/eji.201242944. Epub 2013 Feb 12.

Thpok-independent repression of Runx3 by Gata3 during CD4+ T-cell differentiation in the thymus

Affiliations

Thpok-independent repression of Runx3 by Gata3 during CD4+ T-cell differentiation in the thymus

Yumei Xiong et al. Eur J Immunol. 2013 Apr.

Abstract

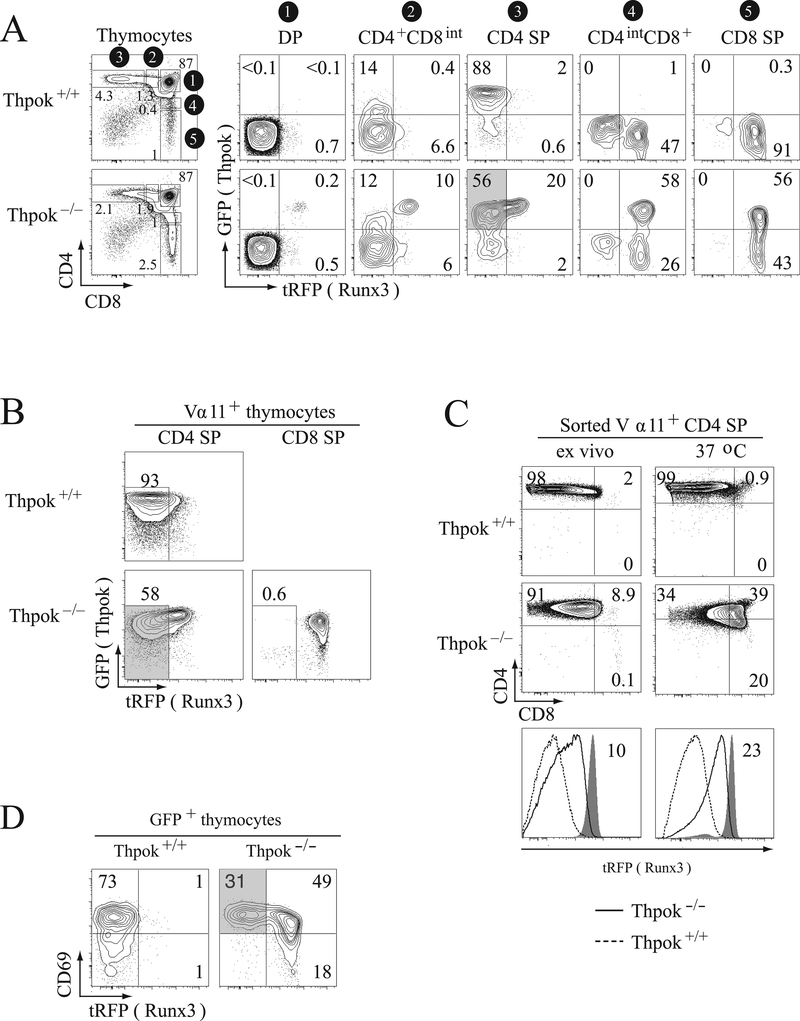
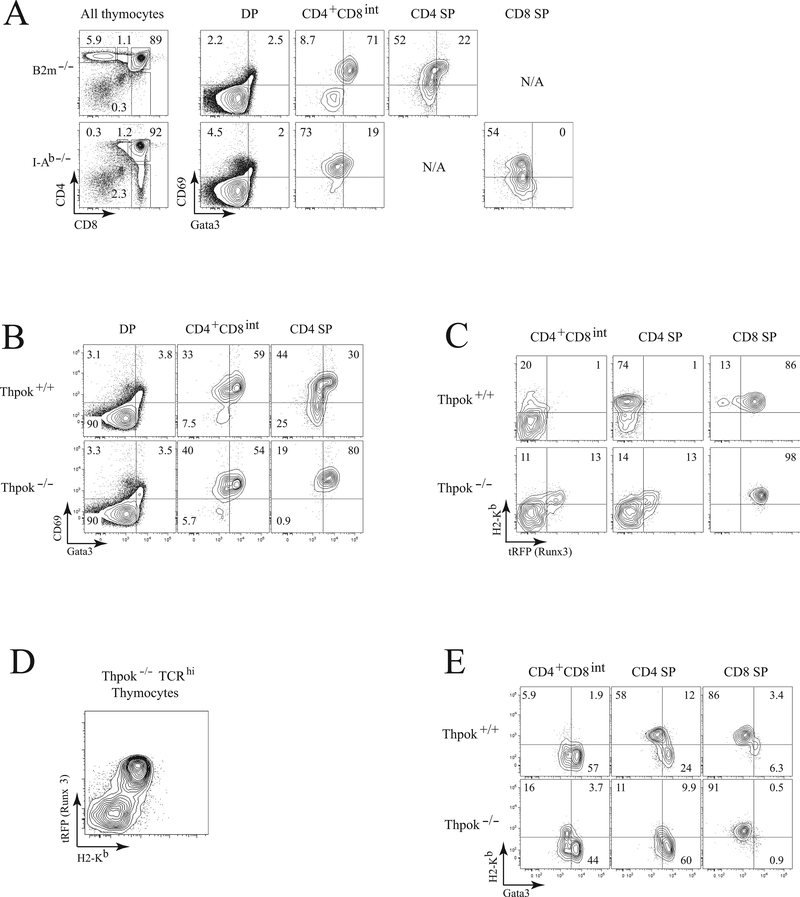
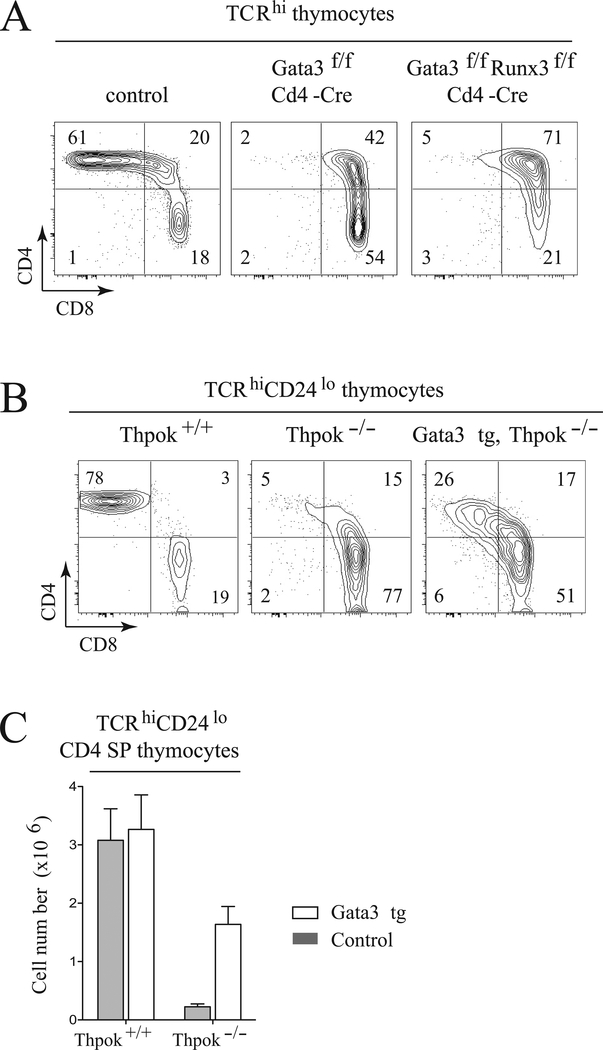
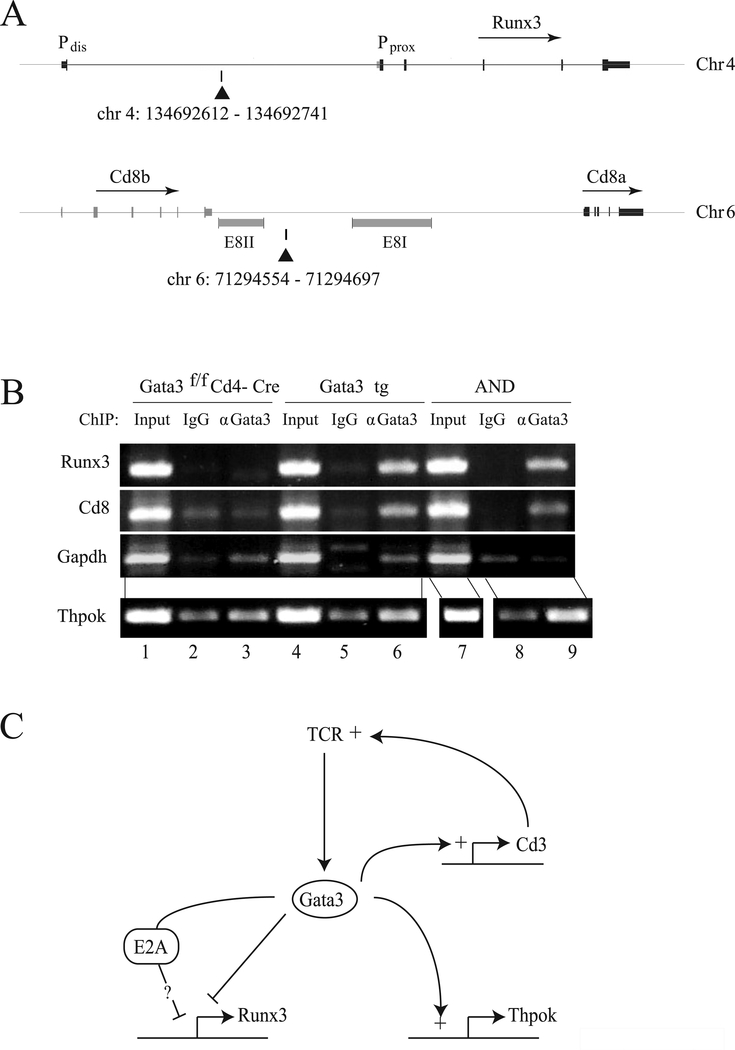
CD4(+) helper T cells are essential for immune responses and differentiate in the thymus from CD4(+) CD8(+) "double-positive" (DP) thymocytes. The transcription factor Runx3 inhibits CD4(+) T-cell differentiation by repressing Cd4 gene expression; accordingly, Runx3 is not expressed in DP thymocytes or developing CD4(+) T cells. The transcription factor Thpok is upregulated in CD4-differentiating thymocytes and required to repress Runx3. However, how Runx3 is controlled at early stages of CD4(+) T-cell differentiation, before the onset of Thpok expression, remains unknown. Here we show that Gata3, a transcription factor preferentially and transiently upregulated by CD4(+) T-cell precursors, represses Runx3 and binds the Runx3 locus in vivo. Accordingly, we show that high-level Gata3 expression and expression of Runx3 are mutually exclusive. Furthermore, whereas Runx3 represses Cd4, we show that Gata3 promotes Cd4 expression in Thpok-deficient thymocytes. Thus, in addition to its previously documented role in promoting CD4-lineage gene-expression, Gata3 represses CD8-lineage gene expression. These findings identify Gata3 as a critical pivot of CD4-CD8 lineage differentiation.


Conflict of interest statement

The authors declare no financial or commercial conflict of interest.

Figures

Figure 1.
Figure 1.. Runx3 repression during CD4-lineage differentiation.
(A) Contour plots show expression of ThpokGFP and Runx3tRFP reporters in the indicated thymocyte subsets from Thpok+/+ and Thpok−/− mice (gating on the left, gate numbers shown on a black background). Note the expression of ThpokGFP in the CD4intCD8+ and CD8 SP subsets in Thpok−/− mice, identifying MHC II-restricted ‘redirected’ thymocytes. The gray-shaded box in column 3 (bottom) contains ThpokGFP+ Runx3tRFP– cells. (B) Contour plots of ThpokGFP and Runx3tRFP expression in Vα11+ CD4 or CD8 SP thymocytes from Thpok−/− and Thpok+/+ mice carrying the MHC-II-restricted AND TCR transgene; gates are defined in Supporting Information Fig. 1. The gray-shaded area identifies ThpokGFP+ Runx3tRFP– cells. (C) Sorted CD4 SP thymocytes from Thpok+/+ or Thpok−/− AND mice carrying the Runx3tRFP reporter were placed in single cell suspension culture overnight and analyzed for expression of surface CD4 and CD8 (top) and tRFP (bottom) before (left) and after (right) culture. Overlaid histograms (bottom) show Runx3tRFP expression in Thpok−/− (solid line histogram) or Thpok+/+ (dashed line histogram) cells. Gray-filled histograms show tRFP fluorescence in CD8 SP cells from AND Thpok−/− mice analyzed in parallel. Numbers in bottom panels indicate tRFP fluorescence relative to CD8 SP controls (gray-shaded histograms) set to 100. (A-C) In each panel, data shown are representative of at least three experiments. (D) Contour plots of CD69 vs. tRFP expression gated on GFP+ thymocytes from Thpok+/+ or Thpok−/− mice carrying both the ThpokGFP and Runx3tRFP reporters. The gray-shaded area identifies the CD69hi GFP+ tRFP subset in Thpok−/− mice.
Figure 2.
Figure 2.. Enforced Gata3 expression represses Runx3 in MHC II-restricted thymocytes.
(A) Expression of intra-cellular Gata3 was analyzed by flow cytometry in Gata3 transgenic thymocyte subsets (solid line histogram) or their non-transgenic counterparts (gray-shaded histograms). The vertical dotted line indicates the peak of Gata3 expression in wild type CD4+CD8int thymocytes. Data are from two mice analyzed in a single experiment, and representative of three independent determinations. (B) Plots depict expression of Runx3tRFP vs. CD69 in post-selection (TCRhi) thymocytes from Gata3 transgenic and control Thpok−/− mice. Numbers below plots show the mean tRFP fluorescence intensity (arbitrary units) in the top and bottom right quadrants; the leftmost plot shows background fluorescence in mice that do not carry the Runx3tRFP reporter. (C) The ratio of tRFP+/tRFP cells among TCRhi CD69hi thymocytes, either Gata3-transgenic (right) or non-transgenic controls (left) is shown. Lines link mice analyzed within the same experiment. (D) Plots show CD4 and CD8 expression in TCRhi CD69hi Thpok−/− thymocytes from the same mice as in (B). (B-D) Data shown are from five pairs of mice analyzed in five distinct experiments.
Figure 3.
Figure 3.. Gata3 represses expression of CD8.
Overlaid histograms show surface CD8 expression on gated pre-selection DP and TCRhi CD8 SP thymocytes from Gata3-transgenic (solid line histogram) and control (gray-filled histogram) thymocytes. Data shown are representative of five experiments.
Figure 4.
Figure 4.. Runx3 and high-level Gata3 expression are mutually exclusive in- thymocytes.
(A) Contour plots (right) show intra-cellular Gata3 and surface CD69 expression in MHC II- (top, from B2m−/− mice) and MHC I-restricted (bottom, from MHC-II-deficient mice) thymocyte subsets as gated on the left. (B) Contour plots show intracellular Gata3 and surface CD69 expression in Thpok+/+ (top) and Thpok−/− (bottom) thymocyte subsets gated as in (A). (C) Expression of H-2Kb and Runx3tRFP in Thpok+/+ and Thpok−/− thymocytes gated as indicated in (A). (D) Plots show surface H-2Kb vs. Runx3tRFP expression in gated TCRhi thymocytes from Thpok−/− mice. (E) Plots show intracellular Gata3 vs. surface H-2Kb expression in CD4+CD8int, CD4 SP and CD8 SP thymocytes from Thpok+/+ and Thpok−/− mice. Data shown are representative of two or more experiments.
Figure 5.
Figure 5.. Gata3 delays the CD8-redirection of Thpok-deficient thymocytes.
(A) Plots show CD4 and CD8 surface expression in TCRhi thymocytes from wild-type (control) mice, Gata3f/f or Runx3f/f Gata3f/f Cd4-Cre mice; data shown are from one experiment representative of three performed. (B) CD4 and CD8 expression in TCRhi CD24lo thymocytes from Thpok+/+ mice, and from Gata3-transgenic and control Thpok−/− mice. Data shown are from one experiment representative of three performed. (C) The number of TCRhi CD24lo CD4 SP thymocytes from the indicated mice is shown as mean + SD. Data pooled from five independent experiments analyzing 14 Thpok−/− mice (7 each Gata3 transgenic and control) and 8 Thpok+/+ mice (4 each Gata3 transgenic and control).
Figure 6.
Figure 6.. Gata3 binds to Runx3 and Cd8 loci
(A) Chromosomal coordinates and schematic representations of Runx3 and Cd8 loci were obtained from the UCSC genome browser (mm9 mouse genome assembly). Location of PCR amplicons identifying Gata3 binding sites in each locus are shown by black triangles. Pdis and Pprox refer to the distal and proximal Runx3 promoters respectively. Note the Gata3 binding site location immediately downstream of the Cd8 E8(II) enhancer active throughout T-cell development [6]. (B) ChIP analyses of Gata3 binding in unseparated thymocytes from AND TCR transgenic, Gata3 transgenic or Gata3-deficient mice. Agarose-gel bands show PCR amplicons on the Cd8, Runx3, Gapdh (as a control for background) and Thpok (as a positive control, site A in Ref. [22]) loci from anti-Gata3 or control IgG immunoprecipitates, or from unfractionated chromatin (input). Data shown are representative of at least two separate experiments (two distinct mice of each genotype). (C) Central position of Gata3 in the circuitry of CD4-lineage differentiation. Gata3 (i) preserves bi-potency of MHC II-signaled thymocytes by repressing Runx3 (this study, left), (ii) promotes TCR signaling, possibly through binding to genes encoding CD3 subunits (top right, [35, 40]), and (iii) promotes Thpok expression (bottom right, [22]).

Similar articles

Cited by

References

    1. Paul WE, (ed). Fundamental Immunology, 6th Edition. Lippincott Williams & Wilkins, Philadelphia: 2008.
    1. Bosselut R, CD4/CD8-lineage differentiation in the thymus: from nuclear effectors to membrane signals. Nat Rev Immunol 2004. 4:529–540. - PubMed
    1. Carpenter AC and Bosselut R, Decision checkpoints in the thymus. Nat Immunol 2010. 11:666–673. - PMC - PubMed
    1. Singer A, Adoro S and Park JH, Lineage fate and intense debate: myths, models and mechanisms of CD4- versus CD8-lineage choice. Nat Rev Immunol 2008. 8:788–801. - PMC - PubMed
    1. Adoro S, McCaughtry T, Erman B, Alag A, Van Laethem F, Park JH, Tai X et al., Coreceptor gene imprinting governs thymocyte lineage fate. EMBO J 2011. 31:366–377. - PMC - PubMed

Publication types

MeSH terms

Substances

LinkOut - more resources