

Correlation between mean platelet volume and fasting plasma glucose levels in prediabetic and normoglycemic individuals
- PMID: 23311535
- PMCID: PMC3558413
- DOI: 10.1186/1475-2840-12-14
Correlation between mean platelet volume and fasting plasma glucose levels in prediabetic and normoglycemic individuals
Abstract
Background: Prediabetes is an independent risk factor for cardiovascular diseases. Mean platelet volume (MPV) can reflect platelet activity, and high MPV is associated with thrombogenic activation and an increased risk of cardiovascular disease. In diabetic patients, MPV is higher when compared with normal subjects. However, the relationship between MPV and prediabetes is poorly understood. The purpose of the present study was to compare MPV in prediabetic and normoglycemic subjects, and to evaluate the relationship between MPV and fasting plasma glucose (FPG) levels in these two groups.
Methods: We retrospectively studied 1876 Japanese subjects who had undergone health checks at Iida Municipal Hospital. Age, sex, body mass index (BMI), blood pressure, medical history, smoking habits, alcohol intake, lipid profiles, FPG levels, and MPV were evaluated. Subjects were categorized into four groups according to FPG: Q1 (70 mg/dL ≤ FPG < 90 mg/dL, n = 467), Q2 (90 mg/dL ≤ FPG < 95 mg/dl, n = 457), Q3 (95 mg/dL ≤ FPG < 100 mg/dL, n = 442), and Q4 (100 mg/dL ≤ FPG < 126 mg/dL, n = 512). Q1, Q2, and Q3 were defined as normal FPG groups and Q4 was defined as prediabetic group.
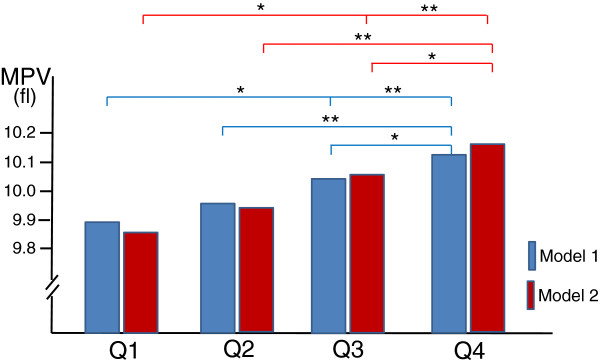
Results: The MPV increased with the increasing FPG levels, in the following order: Q1 (9.89 ± 0.68 fl), Q2 (9.97 ± 0.69 fl), Q3 (10.02 ± 0.72 fl), and Q4 (10.12 ± 0.69 fl). After adjusting for the confounding parameters, MPV of the prediabetic group was higher than that in other groups (P < 0.001 for Q4 vs. Q1 and Q2, and P < 0.05 for Q4 vs. Q3). MPV in the high-normal glucose group (Q3) was significantly higher than in the low-normal glucose group (Q1). MPV was independently and positively associated with FPG, not only in prediabetic subjects but also in normal FPG subjects (β = 0.020 and β = 0.006, respectively).
Conclusions: MPV in patients with prediabetes was higher than that in normal subjects, and was positively associated with FPG levels in prediabetic and normal subjects.
Figures
References
MeSH terms
Substances
LinkOut - more resources
Full Text Sources
Other Literature Sources
Medical
