. 2013 Jan 12:7:2.
doi: 10.1186/1752-0509-7-2.

A kinetic model for RNA-interference of focal adhesions

Affiliations

A kinetic model for RNA-interference of focal adhesions

Max Hoffmann et al. BMC Syst Biol. .

Abstract

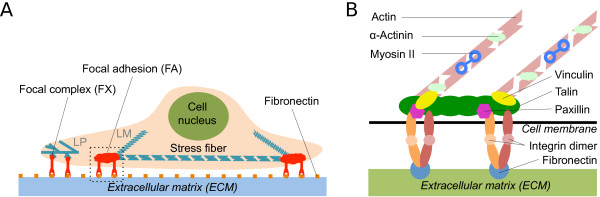
Background: Focal adhesions are integrin-based cell-matrix contacts that transduce and integrate mechanical and biochemical cues from the environment. They develop from smaller and more numerous focal complexes under the influence of mechanical force and are key elements for many physiological and disease-related processes, including wound healing and metastasis. More than 150 different proteins localize to focal adhesions and have been systematically classified in the adhesome project (http://www.adhesome.org). First RNAi-screens have been performed for focal adhesions and the effect of knockdown of many of these components on the number, size, shape and location of focal adhesions has been reported.

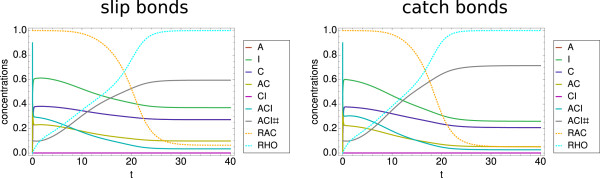
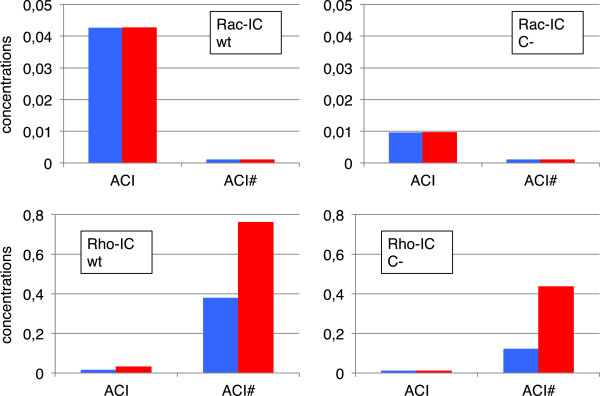
Results: We have developed a kinetic model for RNA interference of focal adhesions which represents some of its main elements: a spatially layered structure, signaling through the small GTPases Rac and Rho, and maturation from focal complexes to focal adhesions under force. The response to force is described by two complementary scenarios corresponding to slip and catch bond behavior, respectively. Using estimated and literature values for the model parameters, three time scales of the dynamics of RNAi-influenced focal adhesions are identified: a sub-minute time scale for the assembly of focal complexes, a sub-hour time scale for the maturation to focal adhesions, and a time scale of days that controls the siRNA-mediated knockdown. Our model shows bistability between states dominated by focal complexes and focal adhesions, respectively. Catch bonding strongly extends the range of stability of the state dominated by focal adhesions. A sensitivity analysis predicts that knockdown of focal adhesion components is more efficient for focal adhesions with slip bonds or if the system is in a state dominated by focal complexes. Knockdown of Rho leads to an increase of focal complexes.

Conclusions: The suggested model provides a kinetic description of the effect of RNA-interference of focal adhesions. Its predictions are in good agreement with known experimental results and can now guide the design of RNAi-experiments. In the future, it can be extended to include more components of the adhesome. It also could be extended by spatial aspects, for example by the differential activation of the Rac- and Rho-pathways in different parts of the cell.


Figures

Figure 1
Figure 1
Schematic presentation of focal adhesions. Schematics of the situation of interest. (A) Cartoon of an adherent cell. During spreading and migration the cell adheres to ligands of the extracellular matrix (ECM), for example fibronectin, at the leading edge through nascent adhesions. They develop into focal complexes in the lamellipodium (LP), which can then mature into focal adhesions in the lamella (LM). Focal adhesions are typically connected to stress fibers that either run from one focal adhesion to another (ventral stress fibers) or end in the actin network (dorsal stress fibers). (B) Enlarged view of a focal adhesion with the main molecular components. The transmembrane protein integrin binds to the fibronectin on the ECM. The connection to the actin stress fibers, which can contract due to the myosin II motor molecules, is made by talin. This basic mechanical link is enhanced by proteins like vinculin, paxillin, or α-actinin.
Figure 2
Figure 2
Scheme of the kinetic model. The overall model scheme reveals the main design principles. The mRNA transcription and degradation are depicted on the left hand side. After the translation of the proteins, these are assembled to focal complexes (ACI). Focal complexes can in turn mature to focal adhesions (ACI#). The assembly process is regulated by Rac and the maturation process is regulated by force and Rho. Depending on the force model used, the reactions marked with a star are either promoting (slip bonds) or suppressing (catch bonds) focal adhesion or focal complex disassembly.
Figure 3
Figure 3
Dynamics of the model without RNA-part. Model without RNA-part. (Upper left panel) Slip bond model with Rac-IC. Note the very short time scale of below one minute for focal complex assembly, the high level of focal complexes and the very low (close to zero) level of focal adhesions. (Upper right panel) Effect of Rho-IC. Now the time scale is about 30 minutes. The result is a high steady state level of focal adhesions and a much lower level of focal complexes. (Lower left panel) Dynamics of the catch bond model with Rac-IC. The result is similar to the slip bond case due to the low level of force. (Lower right panel) Dynamics of the catch bond model with Rho-IC. The time scale remains the same as in the slip bond model, however, the steady state level of focal adhesions is noticeably higher as the focal adhesions are more stable in the catch bond case. Parameter set PS1 was used for these plots.
Figure 4
Figure 4
Dependence on initial conditions. Dynamics of the slip bond and catch bond model without the RNA-part and with initial conditions ACI=0.9, ACI#=0.1, RAC=1, RHO=0. Although there is only a small deviation from the Rac-IC, both models run into a steady state with a high amount of focal adhesions. Again the catch bond model leads to a higher amount of ACI# than the slip bond model. This sensitivity with respect to the initial conditions is very dependent on the parameter set. Both the sub-minute and the sub-hour timescales are visible in both plots. Parameter set PS1 was used for these plots.
Figure 5
Figure 5
Bifurcation analysis. One-parameter bifurcation diagram showing the bistable region resulting from the two initial conditions (Rac-IC and Rho-IC) for the amount of focal adhesions (ACI#) in dependence of ρRHO that describes the influence of the Rho concentration on the force. Parameter set PS1 was used for these plots.
Figure 6
Figure 6
Effect of RNAi. Simulation of knockdown. (Upper left panel) Dynamics of the slip bond model with Rac-IC. The timescale of the siRNA mediated knockdown is about two days. Both the amount of focal complexes and focal adhesions is reduced by about 75-80%. (Upper right panel) Dynamics of the slip bond model with Rho-IC. The knockdown leads to a reduction of about 70% of the amount of focal adhesions. (Lower left panel) Dynamics of the catch bond model with Rac-IC. The result is comparable to the slip bond case. (Lower right panel) Dynamics of the coupled catch bond model with Rho-IC. Here the knockdown leads only to a reduction of about 40% of the amount of focal adhesions, which is considerably less than the 70% reduction in the slip bond case. Parameter set PS3 was used for these plots.
Figure 7
Figure 7
Knockdown results summary. Summary of steady state results for connector knockdown. The amount of ACI and ACI# is shown for wild type conditions and after the knockdown of the connector complex for both the slip bond (blue bars) and the catch bond model (red bars) with the two different initial conditions. In the upper panels, values below 0.001 are displayed as 0.001 and in the lower panels, values below 0.01 are displayed as 0.01. Focal adhesions are most stable under knockdown due to their stabilization through Rho-signaling. Stabilization is further increased by catch bond behavior. Parameter set PS3 was used for these plots.
Figure 8
Figure 8
Knockdown of Rho and of an additional regulating species.(A) Effect of Rho knockdown. While the steady state amount of focal adhesions decreases, the amount of focal complexes increases due to the increased amount of Rac. The slip bond model with parameter set PS2 and Rho-IC was used for this plot. (B) Effect of a knockdown of an additional species Z acting on the degradation of C (see inset). Degradation of Z leads to an increased amount of C and a subsequent increase in the concentrations of both focal complexes and focal adhesions. The slip bond model with parameter set PS3 and Rho-IC was used for this plot.
Figure 9
Figure 9
Effect of a specific assembly pathway and of a mixture of slip and catch bonds.(A) Effect of switching off the reaction of A and C to AC. The steady state values differ from before, however, the general picture remains the same, indicating that our model is capable of dealing with different pathway structures. The catch bond model with parameter set PS1 and Rho-IC was used for this plot. (B) Effect of a mixture of slip and catch bonds. The steady state amount of focal adhesion decreases almost linear with the fraction of slip bonds in the system. Results are shown for the full model before and after the knockdown. Parameter set PS3 and Rho-IC were used for this plot.
Figure 10
Figure 10
Sensitivity Analysis. Concentration control coefficients from sensitivity analysis. (Left panel) Concentration control coefficients (CCCs) for ACI# with respect to the degradation rates of the mRNA for the slip bond model for 300 different parameter sets. Both, for the Rac-IC as well as for the Rho-IC a knockdown of integrin would be most effective for the majority of the parameter sets. Nevertheless, there are parameter sets for which a knockdown of actin would yield the best results. The effectivity of the knockdown of the connector species remains constant for Rac-IC. For most parameter sets the focal adhesions are more stable for Rho-IC. (Right panel) Results for the catch bond model. For Rac-IC the result is comparable to the slip bond model. For Rho-IC, the absolute values of the CCCs are much smaller, indicating that the focal adhesions are much more stable if we assume catch bond behavior.

Similar articles

Cited by

References

    1. Geiger B, Spatz JP, Bershadsky AD. Environmental sensing through focal adhesions. Nat Rev Mol Cell Biol. 2009;10:21–33. doi: 10.1038/nrm2593. - DOI - PubMed
    1. Parsons JT, Horwitz AR, Schwartz MA. Cell adhesion: integrating cytoskeletal dynamics and cellular tension. Nat Rev Mol Cell Biol. 2010;11(9):633–643. doi: 10.1038/nrm2957. - DOI - PMC - PubMed
    1. Geiger B, Yamada KM. Molecular architecture and function of matrix adhesions. Cold Spring Harbor Perspect Biol. 2011;3(5):1–21. - PMC - PubMed
    1. Zaidel-Bar R, Itzkovitz S, Ma’ayan A, Iyengar R, Geiger B. Functional atlas of the integrin adhesome. Nat Cell Biol. 2007;9(8):858–867. doi: 10.1038/ncb0807-858. - DOI - PMC - PubMed
    1. Zaidel-Bar R, Geiger B. The switchable integrin adhesome. J Cell Sci. 2010;123:1385–1388. doi: 10.1242/jcs.066183. - DOI - PMC - PubMed

Publication types

MeSH terms

Substances

LinkOut - more resources