. 2013 Jan 11:10:4.
doi: 10.1186/1742-2094-10-4.

A quantitative spatiotemporal analysis of microglia morphology during ischemic stroke and reperfusion

Affiliations

A quantitative spatiotemporal analysis of microglia morphology during ischemic stroke and reperfusion

Helena W Morrison et al. J Neuroinflammation. .

Abstract

Background: Microglia cells continuously survey the healthy brain in a ramified morphology and, in response to injury, undergo progressive morphological and functional changes that encompass microglia activation. Although ideally positioned for immediate response to ischemic stroke (IS) and reperfusion, their progressive morphological transformation into activated cells has not been quantified. In addition, it is not well understood if diverse microglia morphologies correlate to diverse microglia functions. As such, the dichotomous nature of these cells continues to confound our understanding of microglia-mediated injury after IS and reperfusion. The purpose of this study was to quantitatively characterize the spatiotemporal pattern of microglia morphology during the evolution of cerebral injury after IS and reperfusion.

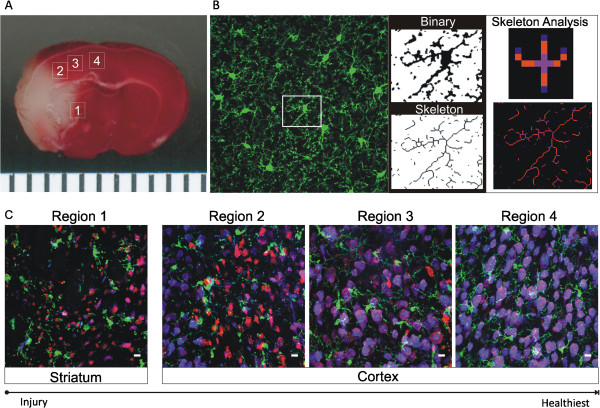
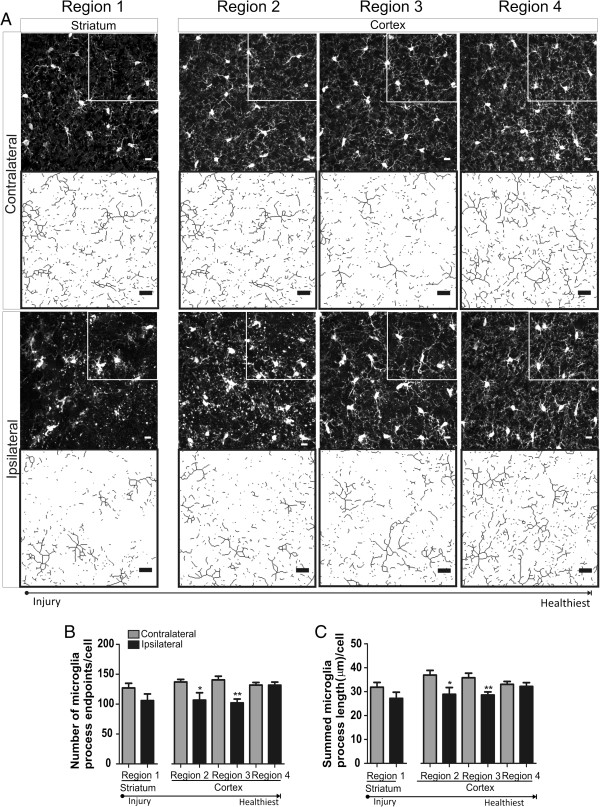
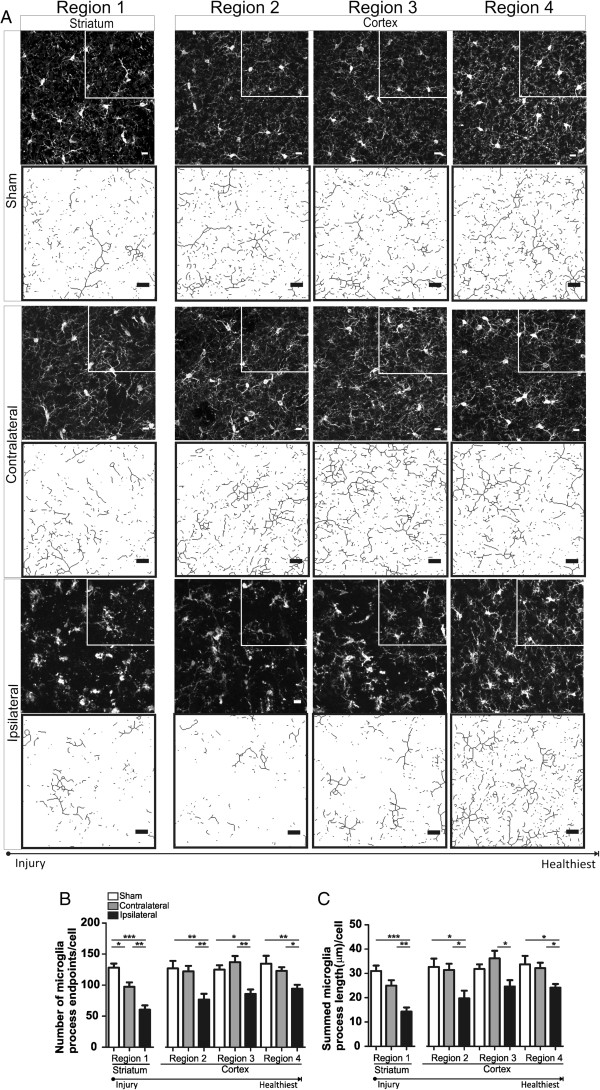
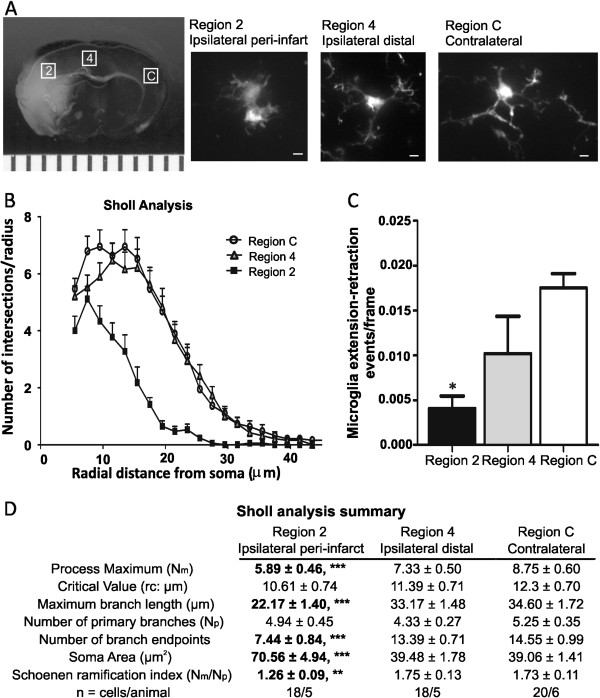
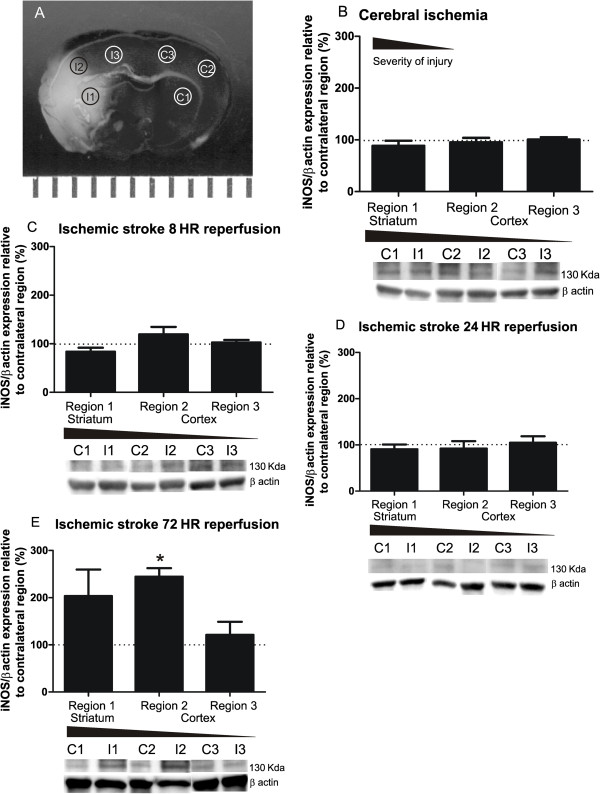
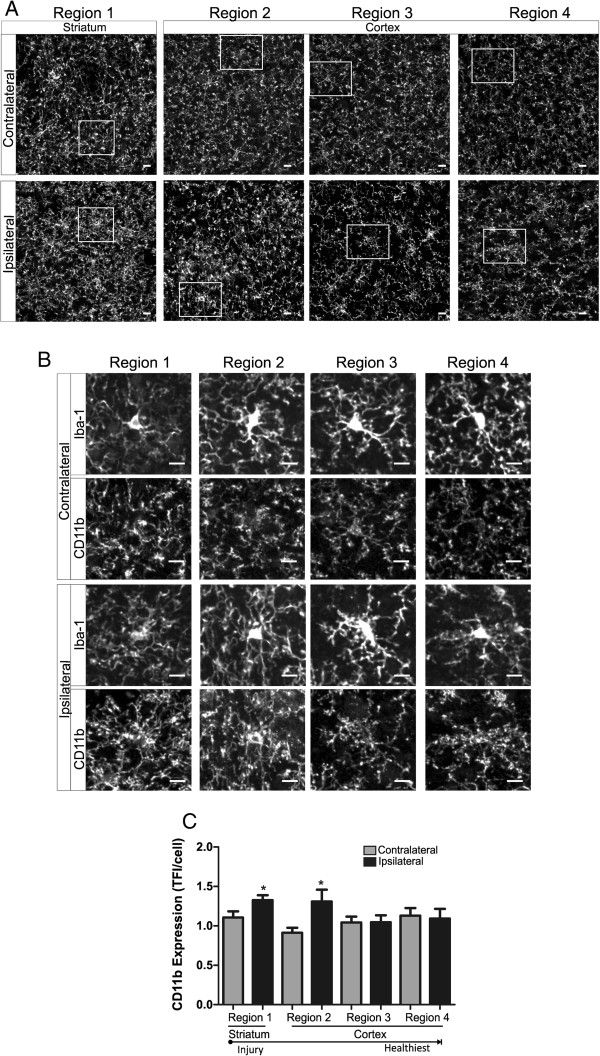
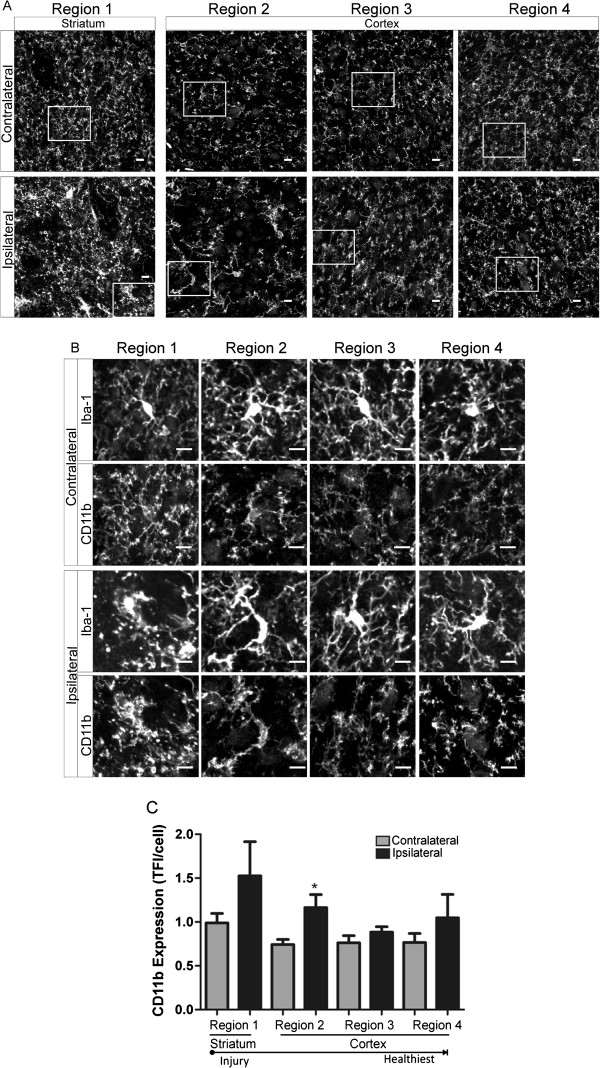
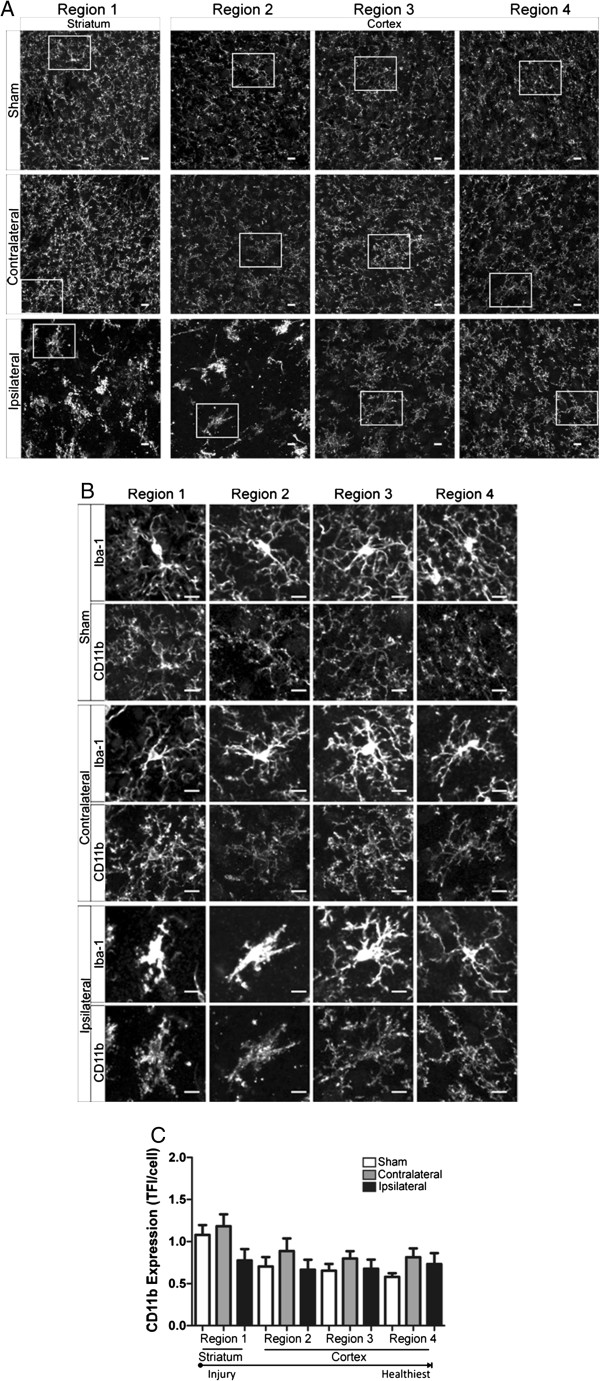
Methods: Male C57Bl/6 mice were subjected to focal cerebral ischemia and periods of reperfusion (0, 8 and 24 h). The microglia process length/cell and number of endpoints/cell was quantified from immunofluorescent confocal images of brain regions using a skeleton analysis method developed for this study. Live cell morphology and process activity were measured from movies acquired in acute brain slices from GFP-CX3CR1 transgenic mice after IS and 24-h reperfusion. Regional CD11b and iNOS expressions were measured from confocal images and Western blot, respectively, to assess microglia proinflammatory function.

Results: Quantitative analysis reveals a significant spatiotemporal relationship between microglia morphology and evolving cerebral injury in the ipsilateral hemisphere after IS and reperfusion. Microglia were both hyper- and de-ramified in striatal and cortical brain regions (respectively) after 60 min of focal cerebral ischemia. However, a de-ramified morphology was prominent when ischemia was coupled to reperfusion. Live microglia were de-ramified, and, in addition, process activity was severely blunted proximal to the necrotic core after IS and 24 h of reperfusion. CD11b expression, but not iNOS expression, was increased in regions of hyper- and de-ramified microglia during the course of ischemic stroke and 24 h of reperfusion.

Conclusions: Our findings illustrate that microglia activation after stroke includes both increased and decreased cell ramification. Importantly, quantitative analyses of microglial morphology and activity are feasible and, in future studies, would assist in the comprehensive identification and stratification of their dichotomous contribution toward cerebral injury and recovery during IS and reperfusion.


Figures

Figure 1
Figure 1
Skeleton analysis of microglia morphology. A Confocal images were acquired in brain regions 1–4 (1 striatum; 2–4 cortex) as illustrated in the TTC image of a typical area of injury after ischemic stroke and 24 h reperfusion (white tissue is necrotic, and red tissue is healthy). Brain regions were conserved across time points in the ipsilateral, contralateral and sham hemispheres. B Maximum intensity projections of confocal images were converted to binary images and then skeletonized. The number of microglia process endpoints (blue) and process length (orange) were summarized for statistical comparisons from Analyze Skeleton plugin by Image J. C Composite images of neurons, microglia and cell death from ipsilateral brain regions 1–4 [blue-neuron (anti-NeuN), green-microglia (anti-iba-1), red-cell death (propidium iodide)]. Scale bar = 10 μm.
Figure 2
Figure 2
Microglia are pleomorphic after 60 min of focal ischemia. A Representative confocal maximum intensity projection images of iba-1 positive microglia and magnified skeletonized inset in brain regions (1 striatum; 2–4 cortex) after 60 min of focal ischemia. B Microglia process endpoints/cell are significantly increased in ipsilateral region 1 but decreased in regions 3 and 4 versus matching contralateral regions. C Microglia process length/cell was significantly decreased in ipsilateral region 4 versus contralateral hemisphere. Data were tested for statistical differences between ipsilateral vs. contralateral regions using Student’s t-test (n = 10, *p < 0.05, **p < 0.01 and ***p < 0.001). All data are mean ± SEM. Scale bar = 10 μm.
Figure 3
Figure 3
Microglia are de-ramified in brain regions proximal to cerebral injury after ischemic stroke and 8 h of reperfusion. A Representative confocal maximum intensity projection images of iba-1 positive microglia and magnified skeletonized inset in brain regions (1 striatum; 2–4 cortex) after 60 min of focal ischemia and 8-h reperfusion. B The number of microglia process endpoints/cell was significantly reduced in ipsilateral regions 2 and 3 versus matching contralateral regions. C Microglia process length/cell was significantly reduced in ipsilateral regions 2 and 3 versus matching contralateral hemispheres. Data were tested for statistical differences between ipsilateral vs. contralateral regions using Student’s t-test (n = 7 *p < 0.05 and **p < 0.001). All data are mean ± SEM. Scale bar = 10 μm.
Figure 4
Figure 4
Microglia ramification is significantly decreased in all ipsilateral regions after ischemic stroke and 24-h reperfusion. A Representative confocal maximum intensity projection images of iba-1 positive microglia and magnified skeletonized inset in brain regions (1 striatum; 2–4 cortex) after 60 min of focal ischemia and 24-h reperfusion (Figure 1A). B Microglia process endpoints/cell are significantly reduced in ipsilateral regions 1–4 versus matching contralateral and sham regions and also significantly reduced in contralateral region 1 versus matching sham. C Microglia process length/cell is significantly decreased in all ipsilateral regions (1–4) versus matching contralateral regions. Ipsilateral microglia process length/cell was significantly reduced versus sham in regions 1, 2 and 4, and no significant differences were detected in contralateral regions versus matching sham. n = 6/sham group; n = 10/contralateral and ipsilateral groups. Data were tested for statistical differences between ipsilateral, contralateral and sham regions using one-way ANOVA and Bonferroni post-hoc testing (*p < 0.05, **p < 0.001, ***p < 0.0001). All data are mean ± SEM. Scale bar = 10 μm.
Figure 5
Figure 5
The spatiotemporal relationship of microglia morphological changes after ischemic stroke and reperfusion. The percent change in the number of microglia process endpoints/cell (A) and microglia process length/cell (B) between the contralateral and ipsilateral regions (1–4) was calculated for each time point (ischemia, ischemia and 8 h of reperfusion, and ischemia and 24 h of reperfusion) for two-way ANOVA analysis. A There was a significant interaction effect between brain regions and time points (F = 4.17, p < 0.001, two-way ANOVA). Main effects, region and time of reperfusion were also significant (F = 3.70, p < 0.05 and F = 20.86, p < 0.0001, respectively). There were significant changes in microglia process endpoints/cell after ischemia and 8 h of reperfusion in region 1 (^p < 0.05 vs. ischemia) and after ischemia and 24 h of reperfusion in region 1, 2 and 3 (^^^p < 0.0001, ^^p < 0.001 and ^p < 0.05 vs. ischemia). There were no significant changes in microglia process endpoints/cell in any region when comparing the 8-h reperfusion and 24-h reperfusion time points (one-way ANOVA analysis with Bonferroni post-hoc). B There was a significant interaction effect between brain regions and time point (F = 2.6, p = 0.01, 2-way ANOVA) and a significant main effect for time of reperfusion but not region (F = 21.16, p < 0.0001 and F = 1.54, p = 0.20, respectively). There were significant changes in microglia process endpoints/cell after ischemia and 24 h of reperfusion in regions 1, 2 and 3 (^^^p < 0.0001, ^^p < 0.001 and ^p < 0.05 vs. ischemia) but no significant changes in any region when comparing after ischemia and 8 h of reperfusion vs. ischemia only or ischemia and 8 h of reperfusion and ischemia and 24 h of reperfusion (one-way ANOVA with Bonferroni post-hoc analysis).
Figure 6
Figure 6
Microglia ramification and activity are decreased in the peri-infarct region after ischemic stroke and 24-h reperfusion. A Exemplary maximum projection intensity images of live microglia in brain regions 2 (ipsilateral peri-infarct region), 4 (ipsilateral distal to necrotic core) and C (contralateral region). Brain regions for image acquisition in relation to cerebral injury are as shown in a representative TTC image. B Sholl analysis plot of microglia. C Microglia process movement is significantly decreased in region 2 (ipsilateral peri-infarct) after ischemic stroke and 24-h reperfusion. D Sholl analysis data summary. Microglia nearest to the infarct core have a significantly increased soma size and decreased maximum branch length, number of branch endpoints, process maximum and ramification index when compared to cells in the contralateral hemisphere. Sample size is as listed in the figure. Data were tested for statistical differences between groups, using one-way ANOVA and Bonferroni post-hoc testing (*p < 0.05, **p < 0.001, ***p < 0.0001). All data are mean ± SEM. Scale bar = 5 μm.
Figure 7
Figure 7
Tissue iNOS expression is not altered during the first 24 h after cerebral ischemia and reperfusion. A Brain tissue for Western blot analysis of iNOS expression was acquired in regions 1–3 (1 striatum; 2, 3 cortex) as illustrated in the TTC image of a typical area of injury after ischemic stroke and 24-h reperfusion. Brain regions were conserved across all time points in the ipsilateral and contralateral hemispheres. B iNOS expression, normalized to β actin, is not significantly changed relative to the contralateral hemisphere (100%) after 60 min of focal ischemia (n = 5), C nor after ischemic stroke and 8 h (n = 4) or D ischemic stroke and 24 h of reperfusion (n = 5). E iNOS expression was significantly increased in the cortical ipsilateral region proximal to the necrotic core after 60 min of ischemia and 72 h of reperfusion (n = 3). Data were tested for statistical differences in iNOS expression from contralateral (100%) using a one-sample t-test (*p < 0.05). All data are mean ± SEM.
Figure 8
Figure 8
CD11b expression is increased in regions of hyper-ramified but not de-ramified microglia after 60 min of focal cerebral ischemia. A Representative confocal maximum intensity projection images of CD11b expression in ipsilateral and contralateral brain regions (1 striatum; 2–4 cortex) after 60 min of focal ischemia. B Enlarged image of microglia (top panel, iba-1) and corresponding CD11b expression (bottom panel) from boxed region as depicted in (A). C Microglia CD11b expression was significantly increased in ipsilateral regions 1 and 2 versus matching contralateral hemispheres. Data were tested for statistical differences between ipsilateral vs. contralateral regions using Student’s t-test (n = 10, *p < 0.05). All data are mean ± SEM. Scale bar = 10 μm.
Figure 9
Figure 9
Microglia CD11b expression is increased after ischemic stroke followed by 8 h of reperfusion in cortical regions proximal to the necrotic core. A Representative confocal maximum intensity projection images of CD11b expression in ipsilateral and contralateral brain regions (1 striatum; 2–4 cortex) after 60 min of focal ischemia and 8 h of reperfusion. B Enlarged image of microglia (top panel, iba-1) and corresponding CD11b expression (bottom panel) from boxed region as depicted in (A). C Microglia CD11b expression was significantly increased in ipsilateral region 2 versus matching contralateral hemispheres. Data were tested for statistical differences between ipsilateral vs. contralateral regions using Student’s t-test (n = 5, *p < 0.05). All data are mean ± SEM. Scale bar = 10 μm.
Figure 10
Figure 10
CD11b expression is not altered in contralateral or ipsilateral regions after ischemic stroke and 24 h of reperfusion. A Representative confocal maximum intensity projection images of CD11b expression in ipsilateral and contralateral brain regions (1 striatum; 2–4 cortex) after 60 min of focal ischemia and 24 h of reperfusion. B Enlarged image of microglia (top panel, iba-1) and corresponding CD11b expression (bottom panel) from boxed region as depicted in (A). C There were no significant changes in microglia CD11b between any experimental groups (sham, contralateral and ipsilateral) at any region after ischemic stroke and 24 h of reperfusion. Data were tested for statistical differences between ipsilateral vs. contralateral regions using one-way ANOVA analysis (n = 5 contralateral/ipsilateral, n = 6 sham, *p < 0.05). All data are mean ± SEM. Scale bar = 10 μm.

References

    1. Roger VL, Go AS, Lloyd-Jones DM, Benjamin EJ, Berry JD, Borden WB, Bravata DM, Dai S, Ford ES, Fox CS. et al. Heart disease and stroke statistics–2012 update: a report from the American Heart Association. Circulation. 2012;125:e2–e220. - PMC - PubMed
    1. Moskowitz MA, Lo EH, Iadecola C. The science of stroke: mechanisms in search of treatments. Neuron. 2010;67:181–198. doi: 10.1016/j.neuron.2010.07.002. - DOI - PMC - PubMed
    1. Sandoval KE, Witt KA. Blood–brain barrier tight junction permeability and ischemic stroke. Neurobiol Dis. 2008;32:200–219. doi: 10.1016/j.nbd.2008.08.005. - DOI - PubMed
    1. Lambertsen KL, Biber K, Finsen B. Inflammatory cytokines in experimental and human stroke. J Cereb Blood Flow Metab. 2012;1:1–22. doi: 10.1038/nature.2012.11818. - DOI - PMC - PubMed
    1. Gelderblom M, Leypoldt F, Steinbach K, Behrens D, Choe CU, Siler DA, Arumugam TV, Orthey E, Gerloff C, Tolosa E, Magnus T. Temporal and spatial dynamics of cerebral immune cell accumulation in stroke. Stroke. 2009;40:1849–1857. doi: 10.1161/STROKEAHA.108.534503. - DOI - PubMed

Publication types