. 2013 Jan 11:14:6.
doi: 10.1186/2050-6511-14-6.

Glibenclamide inhibits cell growth by inducing G0/G1 arrest in the human breast cancer cell line MDA-MB-231

Affiliations

Glibenclamide inhibits cell growth by inducing G0/G1 arrest in the human breast cancer cell line MDA-MB-231

Mariel Núñez et al. BMC Pharmacol Toxicol. .

Abstract

Background: Glibenclamide (Gli) binds to the sulphonylurea receptor (SUR) that is a regulatory subunit of ATP-sensitive potassium channels (KATP channels). Binding of Gli to SUR produces the closure of KATP channels and the inhibition of their activity. This drug is widely used for treatment of type 2-diabetes and it has been signaled as antiproliferative in several tumor cell lines. In previous experiments we demonstrated the antitumoral effect of Gli in mammary tumors induced in rats. The aim of the present work was to investigate the effect of Gli on MDA-MB-231 breast cancer cell proliferation and to examine the possible pathways involved in this action.

Results: The mRNA expression of the different subunits that compose the KATP channels was evaluated in MDA-MB-231 cells by reverse transcriptase-polymerase chain reaction. Results showed the expression of mRNA for both pore-forming isoforms Kir6.1 and Kir6.2 and for the regulatory isoform SUR2B in this cell line. Gli inhibited cell proliferation assessed by a clonogenic method in a dose dependent manner, with an increment in the population doubling time. The KATP channel opener minoxidil increased clonogenic proliferation, effect that was counteracted by Gli. When cell cycle analysis was performed by flow cytometry, Gli induced a significant cell-cycle arrest in G0/G1 phase, together with an up-regulation of p27 levels and a diminution in cyclin E expression, both evaluated by immunoblot. However, neither differentiation evaluated by neutral lipid accumulation nor apoptosis assessed by different methodologies were detected. The cytostatic, non toxic effect on cell proliferation was confirmed by removal of the drug.Combination treatment of Gli with tamoxifen or doxorubicin showed an increment in the antiproliferative effect only for doxorubicin.

Conclusions: Our data clearly demonstrated a cytostatic effect of Gli in MDA-MB-231 cells that may be mediated through KATP channels, associated to the inhibition of the G1-S phase progression. In addition, an interesting observation about the effect of the combination of Gli with doxorubicin leads to future research for a potential novel role for Gli as an adjuvant in breast cancer treatment.


Figures
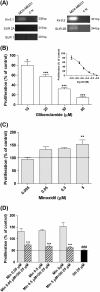
Figure 1
Figure 1
Effect of Glibenclamide, a specific blocker of the KATP channels, on cell growth. The figure shows the mRNA expression of KATP channels components and the effect of Gli and minoxidil (Min) on cell proliferation in MDA-MB-231 cells. Proliferation was evaluated by counting of colonies with 50 cells or more and expressed as percentage of values obtained with vehicle (means ± SEM of three experiments on parallel). Panel A: mRNA expression of KATP channels in MDA-MB-231 cells by RT-PCR analysis. Agarose gel electrophoresis of PCR products showed bands corresponding to: Kir6.1 (336 bp), Kir6.2 (301 bp), SUR2B (312 bp). No bands were detected for SUR2A (215 bp) or SUR1 (291 bp). CN: negative control Panel B: Inhibition of proliferation obtained with different concentrations of Gli (10, 20, 30 or 50 μM). Insert shows the dose–response curve used to determine IC50 (IC50 = 25 μM). Panel C: Increase of proliferation obtained with Min 0.05; 0.5 or 5 μM. Panel D: Results obtained with IC50 Gli plus different concentration of Min. Panel B and C: *p < 0.05 vs. control; **p < 0.01 vs control; ***p < 0.001 vs. control, One way ANOVA and Dunnet post test. Panel D: ***p < 0.01 vs. Min 0.05 μM; vs. Min 0.5 μM; vs. Min 5 μM. ###p < 0.001 vs. Min 0.05 μM; vs. Min 0.5 μM; vs. Min 5 μM. One way ANOVA and Tuckey post test.
Figure 2
Figure 2
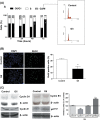
Effect of Glibenclamide on cell cycle progression. Panel A: Synchronized MDA-MB-231 cells were treated with IC50 Gli (25 μM) or vehicle for 24, 48 or 72 h and the fraction of cells in each phase of cell cycle was evaluated by flow citometry. Gli treatment clearly arrested cells at G0/G1 phase. Results are expressed as percentage of the value obtained with vehicle (means ± SEM of three experiments on parallel). °p < 0.01 vs control; *p < 0.001 vs control, t test. Left bars: control; right bars: Gli-treated cells. Panel B: A decrease in BrdU incorporation to DNA was observed when cells were treated with 25 μM Gli for 48 h. Results are expressed as the means ± SEM of three experiments on parallel. *p < 0.05 vs. control, t test. Panel C: Expression of G1-S regulatory proteins in MDA-MB-231 cells treated with Gli or vehicle for 72 h was analyzed by Western blot. Gli decreased the level of cyclin E and increased p27Kip1. Representative immunoblot images of cyclins D1, B1, E and p27Kip1 are illustrated. Relative quantification was performed by densitometric analyses. Actin densitometric values were used to standardize for protein loading. Bars represent the mean ± SEM of three independent experiments. **p < 0.01 vs control; ***p < 0.001 vs control, t test.
Figure 3
Figure 3
Evaluation of apoptosis by Annexin-V method. Apoptosis was assessed after incubating the cells with Gli or vehicle by 72 h. For positive control cells were treated with H2O2 (5 mM) for 30 minutes. Fluorescence was evaluated immediately after Annexin-V staining by flow cytometry. Gli (25 μM) did not induce an increment in apoptosis of MDA-MB-231 cells. Positive Annexin-V cells are shown in both right quadrants.
Figure 4
Figure 4
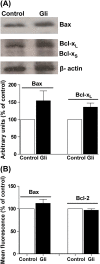
Expression of proteins involved in apoptosis. Panel A: Bax and Bcl-xL/S expression determined by Western Blot employing specific antibodies in MDA-MB-231 cells treated for 72 h with 25 μM Gli (Gli) or vehicle (control) cells. The figure shows a representative Western blot of three independent experiments and the quantification of bands obtained for Bax and Bcl-xL/S protein. Bars represent the mean ± SEM of three independent experiments. p: Non significant (NS), t test. Panel B: Expression of Bcl-2 and Bax protein in MDA-MB-231 cells treated by 72 h with 25 μM Gli (Gli) or vehicle, obtained by flow cytometry. Bars represent the mean fluorescence ± SEM obtained by three independent experiments. p: NS, t test.
Figure 5
Figure 5
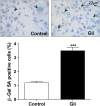
Evaluation of Senescence. MDA-MB-231 cells were cultured for 48 h with 25 μM Gli or with vehicle. Senescence was assessed by the activity of SA-β-GAL. Panel A: representative photographs where positive SA-β-GAL cells are indicated by arrows. Gli produces an increment in cell senescence. Panel B: Percentage of cells SA-β-GAL positive were calculated by counting of at least 1000 cells (630X). Bars represent the mean ± SEM of three independent experiments. *p < 0.001 vs. control, t test.
Figure 6
Figure 6
Evaluation of cytotoxic or cytostatic effect. MDA-MB-231 cells treated with 25 μM Gli or vehicle for 3 or 7 days were re-seeded at low density to evaluate clonogenic capacity. After 10 days in culture, the number of colonies was determined and normalized to the number of colonies in controls. Bars show that Gli pre-treatment did not signifcantly affect clonogenic capacity. p: NS, One way ANOVA.
Figure 7
Figure 7
Glibenclamide combination with antineoplasic drugs. MDA-MB-231 cell proliferation was evaluated by counting of colonies with 50 cells or more and expressed as percentage of controls (means ± SEM of three independent experiments). Panel A: Results obtained with tamoxifen (Tam) 0.1, 0.5, 1 or 5 μM. Panel C: Inhibition of proliferation obtained with doxorubicin (Dox) 0.01, 0.05, 0.1 or 0.5 nM. Panel B and D: Results obtained for combination of 25 μM Gli plus different concentrations of Tam or Dox. Panel A and C: *p < 0.05 vs. control; **p < 0.01 vs. control; ***p < 0.001 vs. control, ANOVA and Dunnet post test. Panel B: p: NS vs. Gli 25 μM, t test. Panel D: *p < 0.05 vs. Dox 0.01 nM, vs. Dox 0.1 nM; **p < 0.001 vs Dox 0.05 nM; +p < 0.05 vs. Dox 0.05 nM + Gli 25 μM; ++p < 0.001 vs. Dox 0.1 nM + Gli 25 μM. One way ANOVA and Tuckey post test.

Similar articles

Cited by

References

    1. Krentz AJ, Bailey CJ. Oral antidiabetic agents. Current role in type 2 diabetes. Drugs. 2005;65:385–411. doi: 10.2165/00003495-200565030-00005. - DOI - PubMed
    1. Lebovitz HE. Treating hyperglycemia in type 2 diabetes: new goals and strategies. Cleve Clin J Med. 2002;69:809–820. doi: 10.3949/ccjm.69.10.809. - DOI - PubMed
    1. Lebovitz HE. Oral antidiabetic agents. Med Clin North Am. 2004;88:847–863. doi: 10.1016/j.mcna.2004.05.002. - DOI - PubMed
    1. Shorter K, Farjo NP, Picksley SM, Randall VA. Human hair follicles contain two forms of ATP-sensitive potassium channels, only one of which is sensitive to minoxidil. FASEB J. 2008;22:1725–1736. doi: 10.1096/fj.07-099424. - DOI - PubMed
    1. Groop LC. Sulphonylureas in NIDDM. Diabetes Care. 1992;15:737–754. doi: 10.2337/diacare.15.6.737. - DOI - PubMed

Publication types

MeSH terms