. 2013 Jan 8;17(1):141-52.
doi: 10.1016/j.cmet.2012.12.007.

Genetic control of obesity and gut microbiota composition in response to high-fat, high-sucrose diet in mice

Affiliations

Genetic control of obesity and gut microbiota composition in response to high-fat, high-sucrose diet in mice

Brian W Parks et al. Cell Metab. .

Abstract

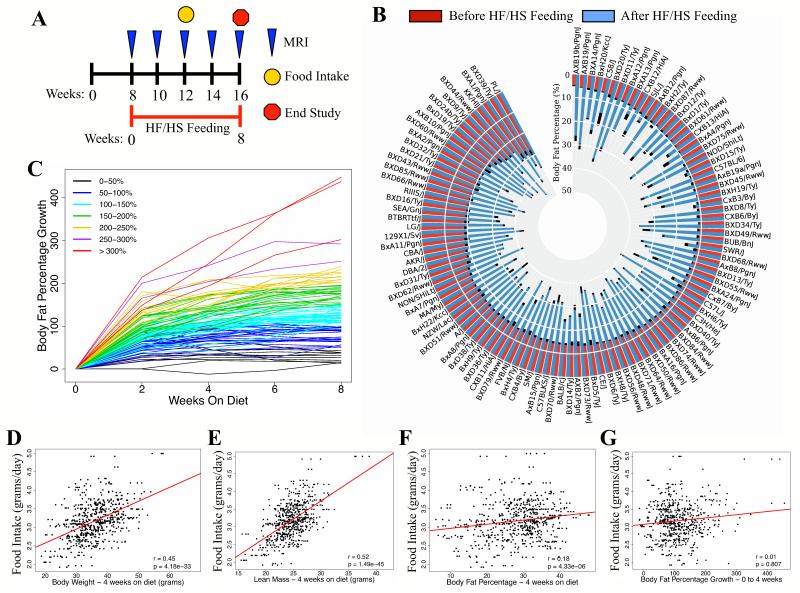
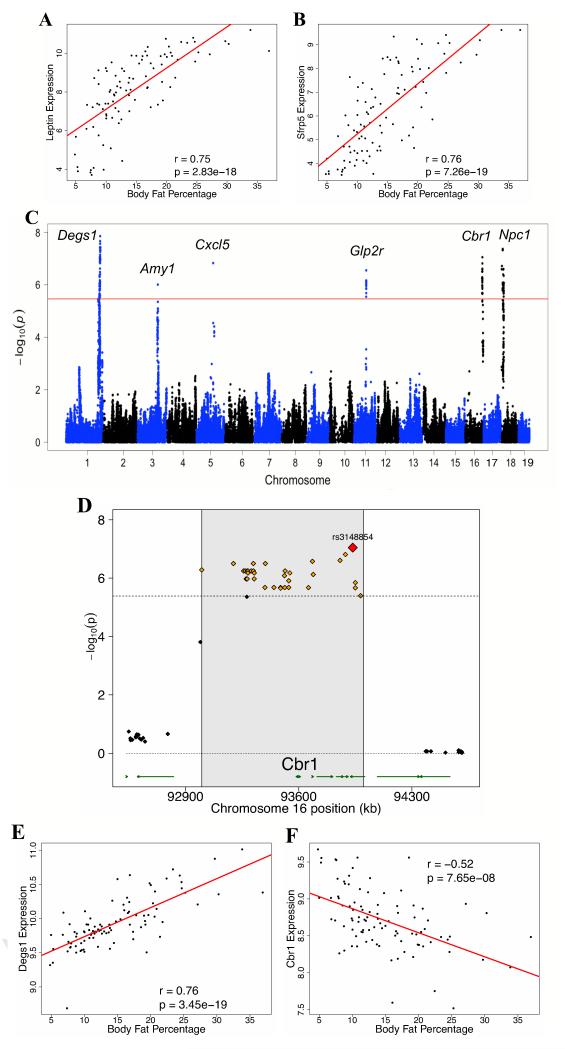
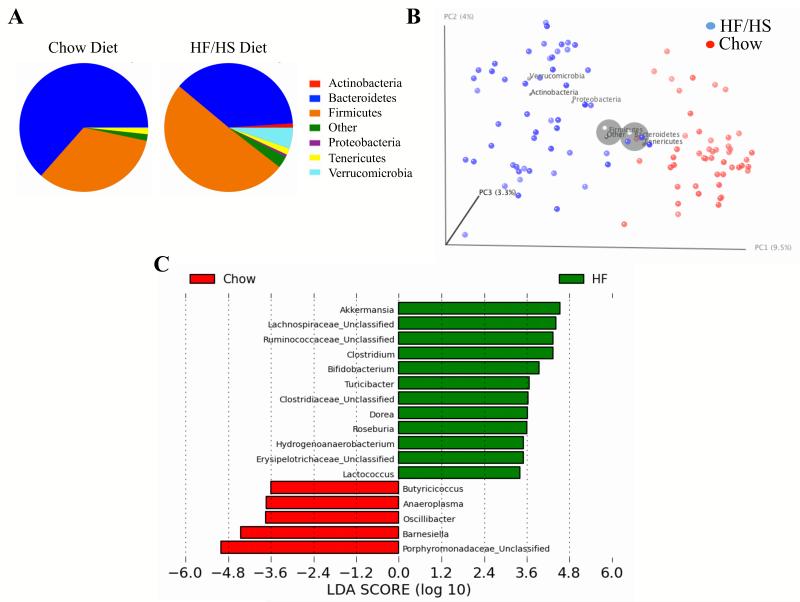
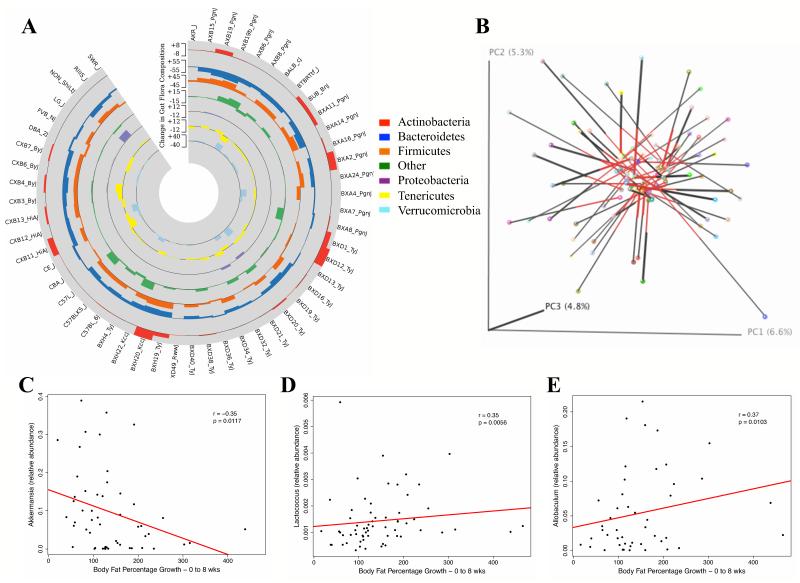
Obesity is a highly heritable disease driven by complex interactions between genetic and environmental factors. Human genome-wide association studies (GWAS) have identified a number of loci contributing to obesity; however, a major limitation of these studies is the inability to assess environmental interactions common to obesity. Using a systems genetics approach, we measured obesity traits, global gene expression, and gut microbiota composition in response to a high-fat/high-sucrose (HF/HS) diet of more than 100 inbred strains of mice. Here we show that HF/HS feeding promotes robust, strain-specific changes in obesity that are not accounted for by food intake and provide evidence for a genetically determined set point for obesity. GWAS analysis identified 11 genome-wide significant loci associated with obesity traits, several of which overlap with loci identified in human studies. We also show strong relationships between genotype and gut microbiota plasticity during HF/HS feeding and identify gut microbial phylotypes associated with obesity.


Figures

Figure 1
Figure 1. Natural Variation in Gene-by-Diet Interactions
(A) Schematic of study design with indicated time points for HF/HS feeding (red), MRI (blue), food intake monitoring (yellow), and end of study (red). MRI, magnetic resonance imaging. (B) Body fat percentage in male mice (108 strains) before (red) and after (blue) 8 weeks of HF/HS feeding. Error bars (black) represent standard error of the mean (SEM) (C) Bi-weekly percent body fat percentage increase in male mice with indicated body fat percentage increase after 8 weeks of HF/HS feeding. (D-G) Correlation of food intake (grams/day/mouse) with body weight (D), lean mass (E), body fat percentage – 4 weeks on HF/HS diet (F), and body fat percentage growth – 0 to 4 weeks (G), regression line (red). r, biweight midcorrelation, p, p-value.
Figure 2
Figure 2. Genetic Control of Dietary Responses to HF/HS Feeding
(A-B) Correlation of epididymal adipose gene expression of Leptin (Lep) (A) and Sfrp5 (B) with body fat percentage in male HMDP mice fed a chow diet, regression line (red). r, biweight midcorrelation, p, p-value. (C) Manhattan plot showing the significance (−log10 of p) of all SNPs and percent body fat percentage increase after 8 weeks of HF/HS feeding in male HMDP mice. Candidate genes for genome-wide significant loci are indicated above genome-wide significant loci. Genome-wide significant threshold (red) of p=4.1 × 10−06 is indicated. (D) Locus plot for genome-wide significant association at chromosome 16qC4 with approximate LD block (shaded in grey) and genome-wide significant SNPs (yellow) with the peak SNP (red). (E-F) Correlation of epididymal adipose gene expression of Degs1 (E) and Cbr1 (F) with body fat percentage in male HMDP mice fed a chow diet, regression line (red). r, biweight midcorrelation, p, p-value.
Figure 3
Figure 3. Robust Shifts in Gut Microbiota Composition After HF/HS Feeding
(A) Relative abundances of the different phyla after chow diet and HF/HS feeding (average among 52 matched strains). (B) Principal Coordinates Analysis (PCoA) plot of the unweighted UniFrac distances. Each circle representing a different mice strain is colored according to the dietary conditions. PC1, PC2 and PC3 values for each mouse sample are plotted; percent variation explained by each PC is shown in parentheses. (C) Linear Discriminant Analysis (LDA) coupled with effect size measurements identifies the most differentially abundant taxons between chow and HF/HS diets. HF/HS diet enriched taxa are indicated with a positive LDA score (green), and taxa enriched in normal chow diet have a negative score (red). Only taxa meeting an LDA significant threshold >2 are shown.
Figure 4
Figure 4. Plasticity of Gut Microbiota is Strain-Specific
(A) Gut Microbiota phyla shift in 52 strains after HF/HS feeding for 8 weeks indicated by shift in percent composition of indicated phylum. (B) Procrustes analysis of the same strains on chow diet and the HF/HS diet are linked with a bar. The unweighted UniFrac distances between the diets varies across strains, but are in general long, highlighting the shifts in microbial composition in response to diet. (C-E) Correlation of relative abundance of Akkermansia (A), Lactococcus (B), and Allobaculum (C) with body fat percentage increase from 0 to 8 weeks in male mice fed a HF/HS diet, regression line (red), r, biweight midcorrelation, p, p-value.

Similar articles

Cited by

References

    1. Attie AD, Scherer PE. Adipocyte metabolism and obesity. J Lipid Res. 2009;50(Suppl):S395–399. - PMC - PubMed
    1. Barrett ML, Udani JK. A proprietary alpha-amylase inhibitor from white bean (Phaseolus vulgaris): a review of clinical studies on weight loss and glycemic control. Nutr J. 2011;10:24. - PMC - PubMed
    1. Barsh GS, Farooqi IS, O’Rahilly S. Genetics of body-weight regulation. Nature. 2000;404:644–651. - PubMed
    1. Bateman RL, Rauh D, Tavshanjian B, Shokat KM. Human carbonyl reductase 1 is an S-nitrosoglutathione reductase. J Biol Chem. 2008;283:35756–35762. - PMC - PubMed
    1. Bennett BJ, Farber CR, Orozco L, Kang HM, Ghazalpour A, Siemers N, Neubauer M, Neuhaus I, Yordanova R, Guan B, et al. A high-resolution association mapping panel for the dissection of complex traits in mice. Genome Res. 2010;20:281–290. - PMC - PubMed

Publication types

Substances

Associated data