

Review
doi: 10.1016/j.rdc.2012.10.004.
Epub 2012 Nov 10.
Epidemiology of osteoarthritis
Affiliations
- PMID: 23312408
- PMCID: PMC3545412
- DOI: 10.1016/j.rdc.2012.10.004
Item in Clipboard
Review
Epidemiology of osteoarthritis
Rheum Dis Clin North Am.
2013 Feb.
Abstract
Osteoarthritis (OA) is the most common form of arthritis in the United States and is a leading cause of disability. It is typically defined in epidemiologic studies by radiographic findings and consideration of symptoms. Its incidence and prevalence are rising, likely related to the aging of the population and increasing obesity. Risk factors for OA include numerous person-level factors, such as age, sex, obesity, and genetics, as well as joint-specific factors that are likely reflective of abnormal loading of the joints. In studying OA, several methodologic challenges exist that can hamper our ability to identify pertinent relationships.
Copyright © 2013 Elsevier Inc. All rights reserved.
Figures
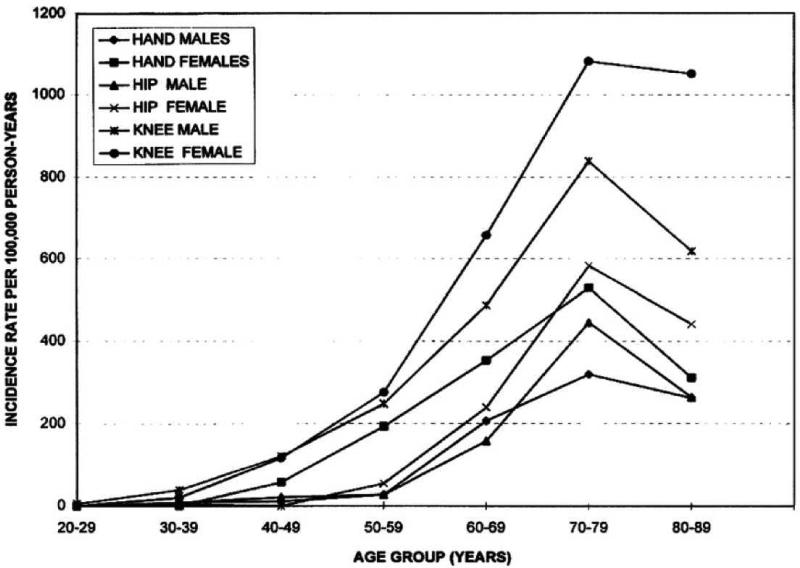
Incidence of hand, hip, and knee OA 1991-1992 by age and sex in a community health plan. Reference: Oliveria SA, et al. Arthritis Rheum. 1995;38:1134-1141.
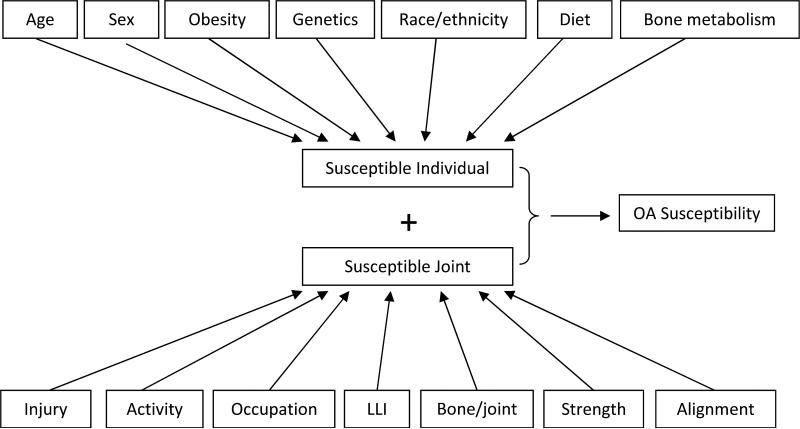
Potential risk factors for susceptibility to OA incidence and progression, each with varying degrees of evidence to support their association (see text for details). LLI=leg-length inequality
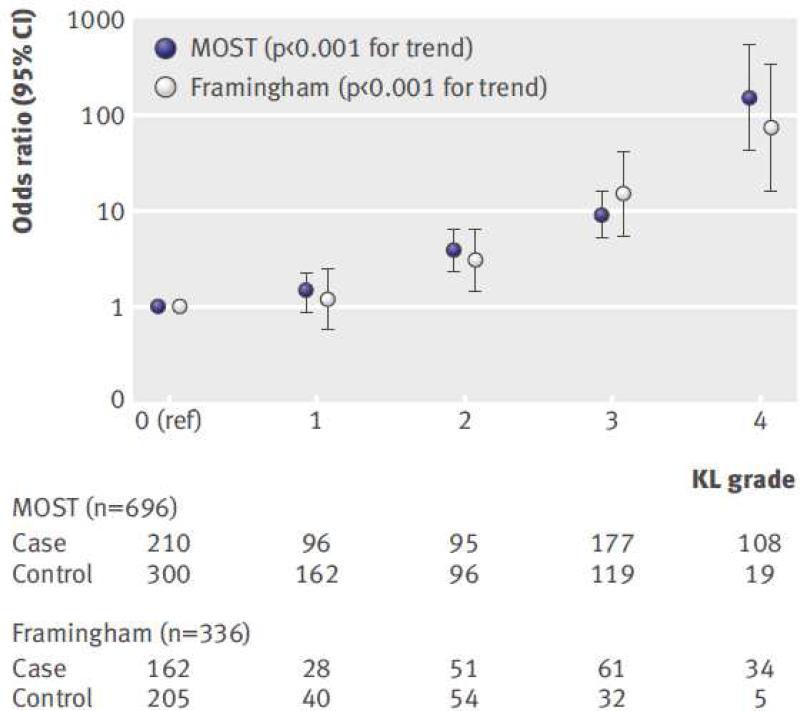
Associations of frequent knee pain with Kellgren and Lawrence (KL) grade among people with two knees discordant for frequent knee pain status. Number of case knees (i.e., with knee pain) and control knees (i.e., without knee pain) are shown beneath the graph for each KL grade. Note the y-axis is logarithmically scaled. Reference: Neogi T, et al. BMJ 2009;339:b2844 doi:10.1136/bmj.b2844
References
-
- Hsiao CJ, Cherry DK, Beatty PC, Rechtsteiner EA. National Ambulatory Medical Care Survey: 2007 summary. Natl Health Stat Report. 2010:1–32. - PubMed
-
- Kellgren JH, Lawrence JS. Atlas of standard radiographs. Oxford University Press; Oxford (UK): 1963.
-
- Altman RD, Hochberg M, Murphy WA, Jr., Wolfe F, Lequesne M. Atlas of individual radiographic features in osteoarthritis. Osteoarthritis Cartilage. 1995;3(Suppl A):3–70. - PubMed
Publication types
MeSH terms
Grants and funding
LinkOut - more resources
Full Text Sources
Other Literature Sources
Medical
