. 2013 Jan 9;77(1):129-40.
doi: 10.1016/j.neuron.2012.10.040.

Fast silencing reveals a lost role for reciprocal inhibition in locomotion

Affiliations

Fast silencing reveals a lost role for reciprocal inhibition in locomotion

Peter R Moult et al. Neuron. .

Abstract

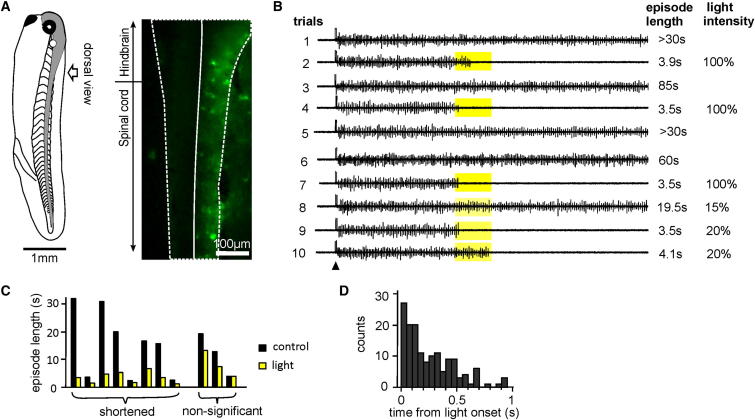
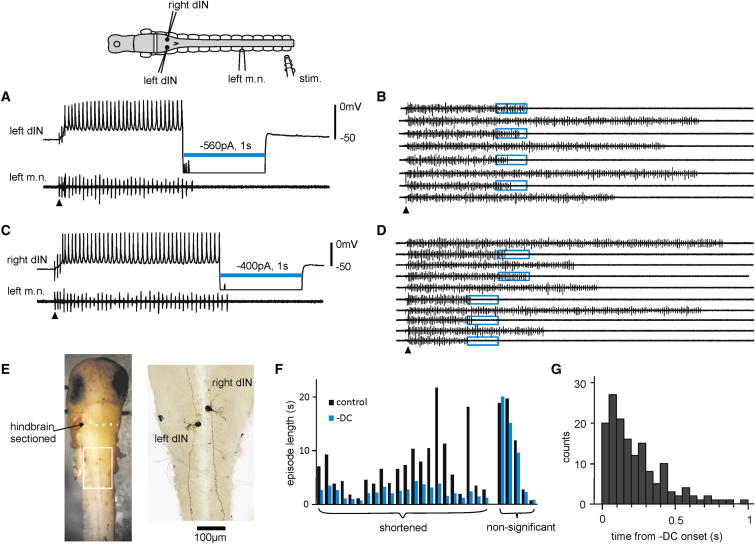
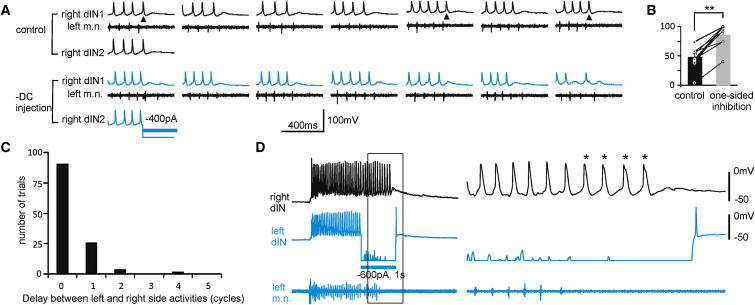
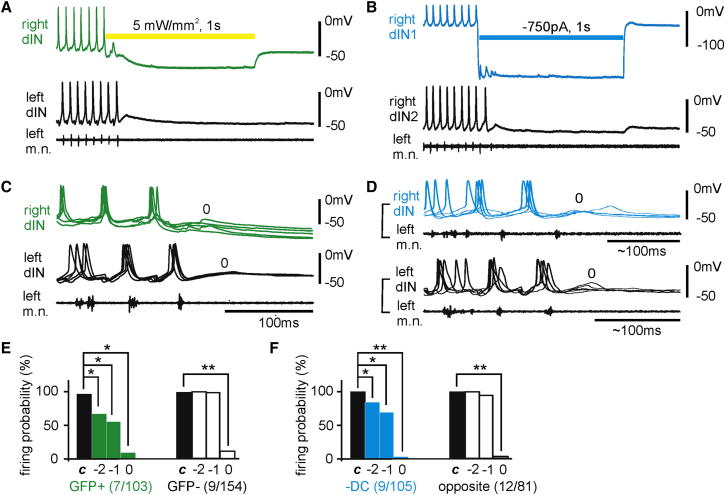
Alternating contractions of antagonistic muscle groups during locomotion are generated by spinal "half-center" networks coupled in antiphase by reciprocal inhibition. It is widely thought that reciprocal inhibition only coordinates the activity of these muscles. We have devised two methods to rapidly and selectively silence neurons on just one side of Xenopus tadpole spinal cord and hindbrain, which generate swimming rhythms. Silencing activity on one side led to rapid cessation of activity on the other side. Analyses reveal that this resulted from the depression of reciprocal inhibition connecting the two sides. Although critical neurons in intact tadpoles are capable of pacemaker firing individually, an effect that could support motor rhythms without inhibition, the swimming network itself requires ~23 min to regain rhythmic activity after blocking inhibition pharmacologically, implying some homeostatic changes. We conclude therefore that reciprocal inhibition is critical for the generation of normal locomotor rhythm.


Figures

Figure 1
Figure 1
Activation of ArCh in Neurons on One Side of the Tadpole Stops Swimming (A) Left: diagram of a stage 37/38 tadpole viewed from the side; the CNS is shown in gray. Right: ArCh-GFP expression in a tadpole at the same stage after injecting ArCh cRNAs into a blastomere at the two-cell stage. The preparation is viewed from above, after removing the skin and muscle; the right (GFP+) and left sides of the CNS are delineated. (B) Ten consecutive trials showing the effect of 1 s periods of illumination on swimming episode length for the tadpole in (A) (recordings are from the left m.n.). Arrowhead points at time of skin stimulation. One hundred percent light intensity is 10 mW/mm2. (C) Average episode lengths with illumination in eight out of 11 tadpoles (paired columns) were significantly shortened. The first pair of columns on the left is a summary of data in (B). (D) Distribution of the time taken for a 1 s period of illumination to stop swimming in 149 successful trials.
Figure 2
Figure 2
Swimming Stopped Abruptly when Large Hyperpolarizing Currents Are Injected into Single dINs (A) Injecting −560 pA into a dIN on the left side stopped swimming. (B) Repetitive trials of 1 s −DC injection (blue boxes) into the dIN shown in (A) alternated with controls. (C) Injecting −400 pA into a dIN on the right side also stopped swimming. (D) Repeated 1 s −DC injections (blue boxes), as shown in (C), were alternated with controls. dINs in (A) and (C) are recorded simultaneously, but only one recording trace is shown to simplify illustration. (E) Neurobiotin staining of the dINs recorded in (A) and (C). Left: dorsal view showing the location of dINs in the caudal hindbrain (dotted line marks location of cross-section). Right: the anatomy of the two dINs with their ipsilateral axons magnified from the boxed area in the left photo. Arrowhead points at the time of skin stimulation in (A)–(D). Recordings in (A) and (C) are off scale during −DC. (F) Average episode lengths are shortened by −DC injections in 22 out of 27 dINs (cf. controls). (G) Distribution of the time taken for a 1 s −DC to stop swimming in 152 successful trials. Top diagram is a dorsal view of the CNS with muscles and electrodes. Hindbrain was sectioned at the white line. m.n., motor nerve recording; Stim., stimulating electrode.
Figure 3
Figure 3
Activity Normally Stops First on the Silenced Side (A) The activity on both sides in the last few cycles in the control and when the right side dINs were injected with −DC (seven trials each, dIN2 activity only shown for the first trial). Arrowheads in the control point to examples where the left side activity stops first. (B) Percentages of control swimming episodes with activity ending first on the left (black) and of trials with activity stopping first on the inhibited side in one-sided silencing (gray). p < 0.05, ∗∗p < 0.01. (C) The distribution of delay between left and right side activity in 123 trials in which activity stopped first on the suppressed side. A half-cycle delay is represented by “0.” (D) One of the two trials in which dIN activity on the opposite side carried on for four more “cycles” (, cf. C) after the activity on the suppressed left side has stopped. Recordings on the right are expanded from the boxed area. Recording of the left dIN during −DC was off scale.
Figure 4
Figure 4
The Firing Probability of Neurons before and during One-Sided Silencing (A) Simultaneous recordings from a dIN on each side of the cord and also from a left m.n. to show the effect of illumination (yellow bar). (B) Simultaneous recordings from two other dINs and left m.n. with −DC injection into dIN1 (blue bar). (C) Five superimposed examples showing the firing of two dINs at the end of episodes in which light stopped swimming within three cycles. (D) Five superimposed recordings of a dIN from the side with −DC injection (blue, top traces) and of another dIN from the opposite side in a separate recording (bottom traces). The recording of the dIN injected with −DC is not shown. In (C) and (D), traces are aligned to the last m.n. bursts and some traces are rescaled horizontally for clarity. Cycle 0 is the period after the last m.n. burst. In (A–D), green traces are recordings from the GFP+ side; blue traces are recordings from the side with −DC injections. (E and F) Summary of the average firing probability in the last three cycles and controls (c is the average of five cycles before silencing). Numerals in brackets are number of cells/trials. We define firing probability of an individual neuron as the percentage of swimming cycles with neuronal firing. See also Figure S1.
Figure 5
Figure 5
One-Sided Silencing Depressed cIN Inhibition and dIN Excitation and Necessity for cIN Inhibition in dIN Rebound Firing (A) The last cycles of a swimming episode, in which light (yellow bar) stopped swimming within one cycle. Different synaptic currents are labeled (c is used as a control cycle). (B) Normalized synaptic currents in dINs in cycle 0, as shown in (A), in light silencing trials (eight dINs, 53 trials). Tonic inward current (IC) was measured as the difference between the clamping current at rest (dashed line in A) and the current level just before each cIN IPSC. (C) Five superimposed trials with −DC injections, aligned to the last m.n. burst, showing synaptic currents in cycle 0. (D) Normalized synaptic currents in dINs in cycle 0 in −DC injection experiments (seven dINs, 51 trials). Synaptic currents are normalized to those in control cycles in (B) and (D). All recordings are from the ArCh-GFP negative side or the side without −DC injections into dINs. (E) dIN usually fires a single spike at the onset of a depolarizing pulse (220 pA, 1 s) but can also fire on rebound. (F) The boxed area is expanded to show rebound spikes following cIN IPSPs (seven trials overlayed). IPSPs failing to evoke dIN rebound spikes are blue. (G) The size of cIN IPSPs that evoked dIN rebound firing (black and gray) and the size of IPSPs that failed to evoke firing (blue). Error bars represent SE. ∗∗p < 0.01.
Figure 6
Figure 6
dIN Pacemaker Firing in an Intact Tadpole and Recovery of Motor Rhythms after Inhibition Blockade (A) The activity of a dIN during swimming in an intact tadpole (left) and after short NMDA applications using microiontophoresis (1.3 nA for 2 s, gray bars). The short period of voltage-clamp recording is marked (arrowed line). (B) NMDA-application trials (1–3) in (A) at a faster time scale. The dIN only fires a single spike to DC injections either before (100 pA) or after (200 pA, black bar) trial 3. Note the absence of m.n. activity and fast synaptic currents in NMDA application trials. (C) The activity of a dIN in control swimming in a tadpole cross-sectioned at the fifth and sixth rhombomere levels. (D) dIN and m.n. activity at different time after bath-applying 2.5 μM strychnine and 20 μM SR95531. Recovery period for motor rhythms in this tadpole is 12 min. Arrows indicate time of skin stimulation (artifacts reduced for clarity).
Figure 7
Figure 7
Hyperexcitation Blocks dIN Pacemaker Properties (A) The responses of a dIN to three consecutive applications of NMDA at different microiontophoresis currents (gray bars). The right hand trial results in repetitive firing followed by seizure-like depolarization. (B) A dIN’s response to microperfusion of 100 μM NMDA in TTX (gray bar). Injecting hyperpolarizing current (−70 pA) into the dIN reveals reliable oscillations, which quickly change to seizure-like depolarization at the current withdrawal. The boxed area (a) is expanded below. The dotted line indicates the resting membrane potential level.
Figure 8
Figure 8
Failure in dIN Rebound Firing May Underlie the Cessation of Swimming after One-Sided Silencing (A) A simplified swimming circuit (circle inhibitory, triangle excitatory, synapses). (B) Simultaneous recordings from a right and a left dIN and also a left m.n. To explain the sequence of events after light silencing, the timing of right m.n. bursts is shown schematically. Dashed lines indicate resting membrane potential levels. Dotted traces in (B) of whole-cell recordings show predictions of the sequence of events (1–4, cf. A) if light illumination (yellow bar) had failed to inhibit the activity in cycle 0 on the GFP+ side (green symbols and traces). Asterisk indicates the timing of m.n. bursts had they occurred. See the main text for more details.

Similar articles

Cited by

References

    1. Arshavsky Yu.I., Orlovsky G.N., Panchin Yu.V., Roberts A., Soffe S.R. Neuronal control of swimming locomotion: analysis of the pteropod mollusc Clione and embryos of the amphibian Xenopus. Trends Neurosci. 1993;16:227–233. - PubMed
    1. Beato M., Nistri A. Interaction between disinhibited bursting and fictive locomotor patterns in the rat isolated spinal cord. J. Neurophysiol. 1999;82:2029–2038. - PubMed
    1. Bracci E., Ballerini L., Nistri A. Localization of rhythmogenic networks responsible for spontaneous bursts induced by strychnine and bicuculline in the rat isolated spinal cord. J. Neurosci. 1996;16:7063–7076. - PMC - PubMed
    1. Brown T.G. The intrinsic factors in the act of progression in the mammal. Proc. R. Soc. Lond. B. 1911;84:308–319.
    1. Brown T.G. On the nature of the fundamental activity of the nervous centres; together with an analysis of the conditioning of rhythmic activity in progression, and a theory of the evolution of function in the nervous system. J. Physiol. 1914;48:18–46. - PMC - PubMed

Publication types