. 2013 Jun:54:239-51.
doi: 10.1016/j.nbd.2012.12.016. Epub 2013 Jan 8.

Microglial activation is not equivalent to neuroinflammation in alcohol-induced neurodegeneration: The importance of microglia phenotype

Affiliations

Microglial activation is not equivalent to neuroinflammation in alcohol-induced neurodegeneration: The importance of microglia phenotype

S Alex Marshall et al. Neurobiol Dis. 2013 Jun.

Abstract

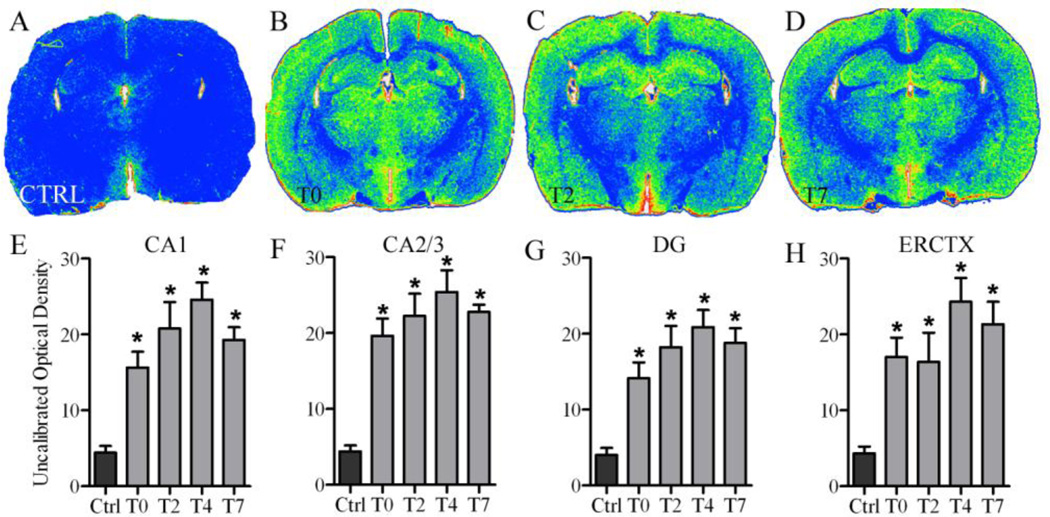
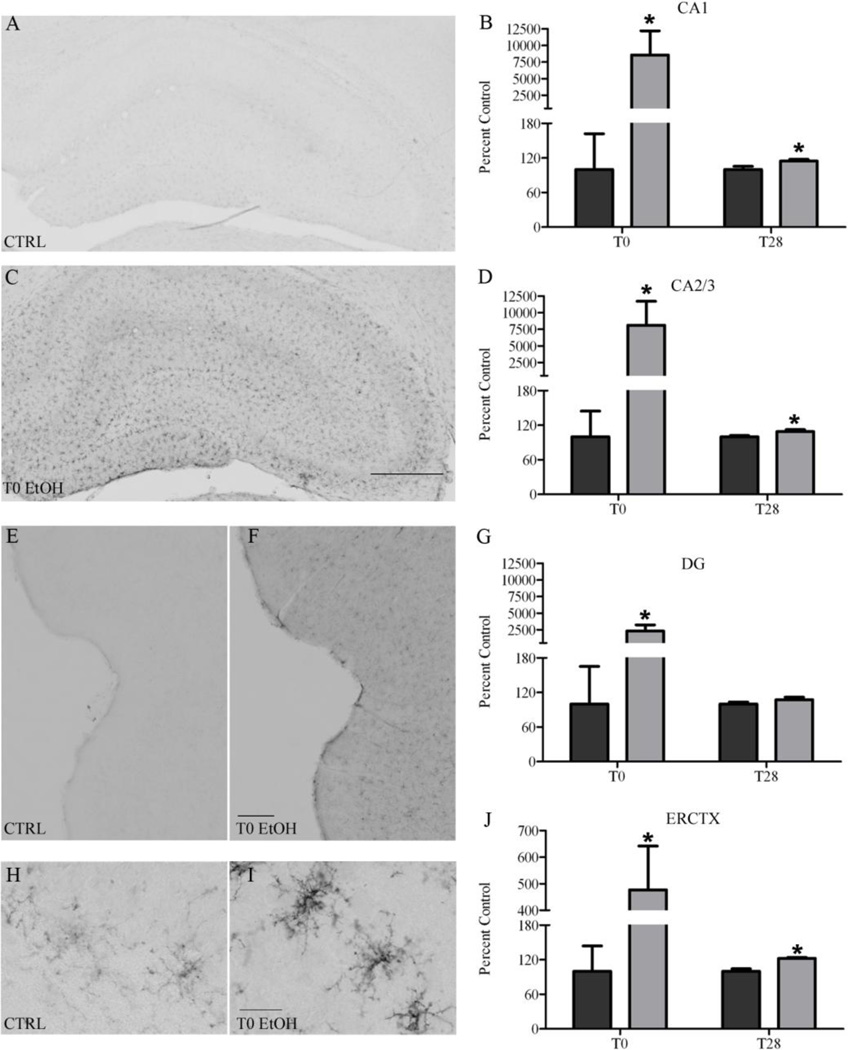
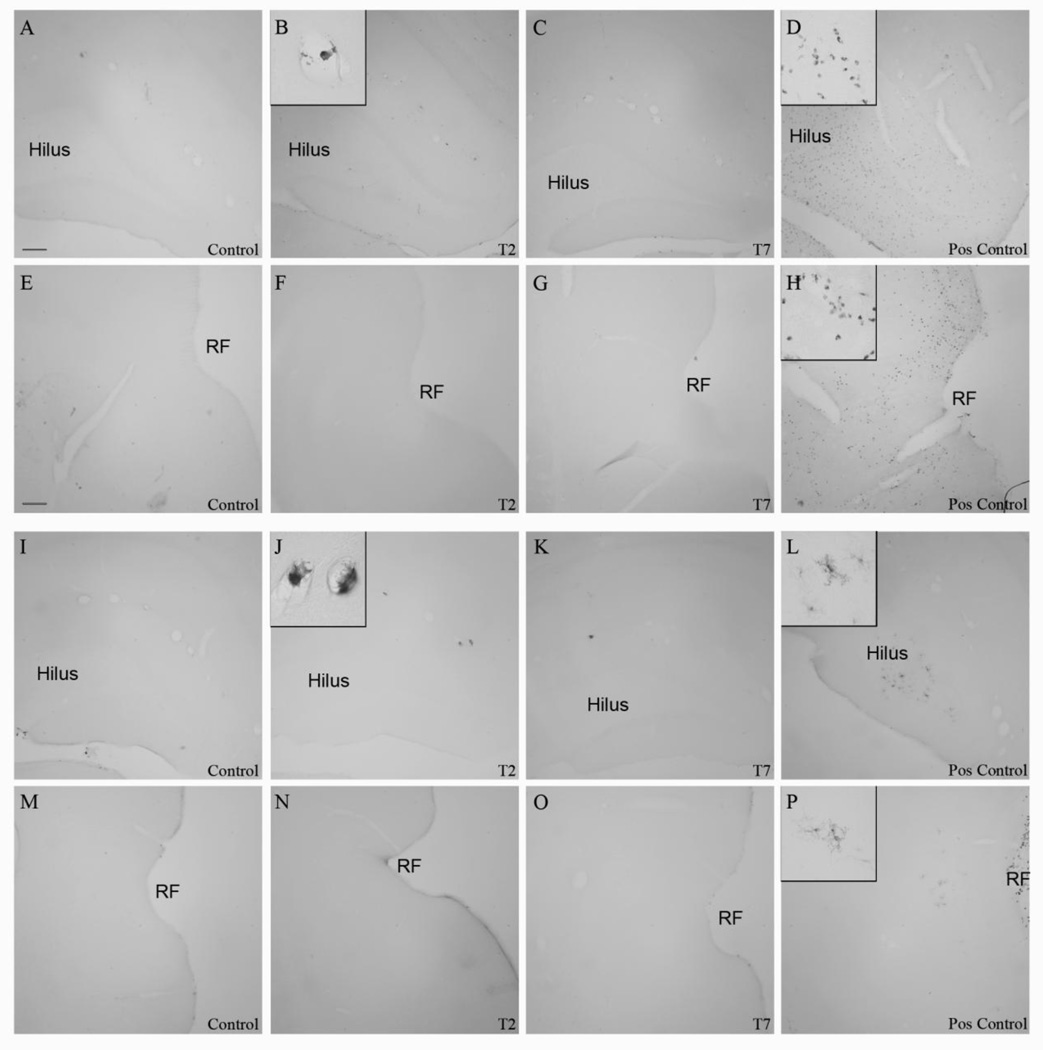
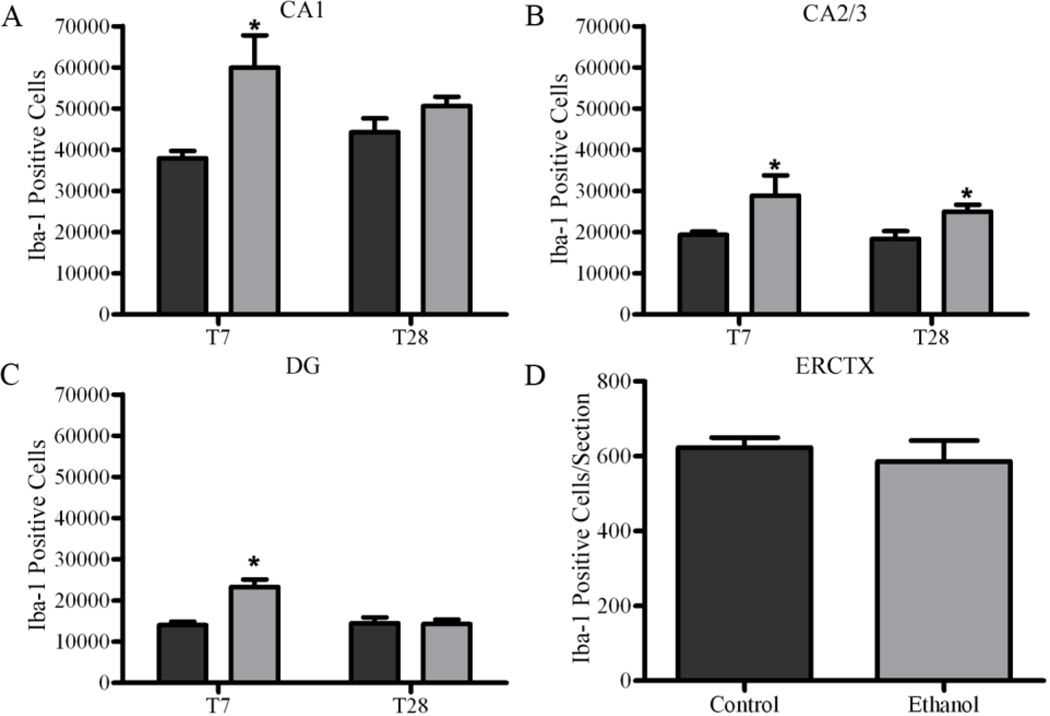
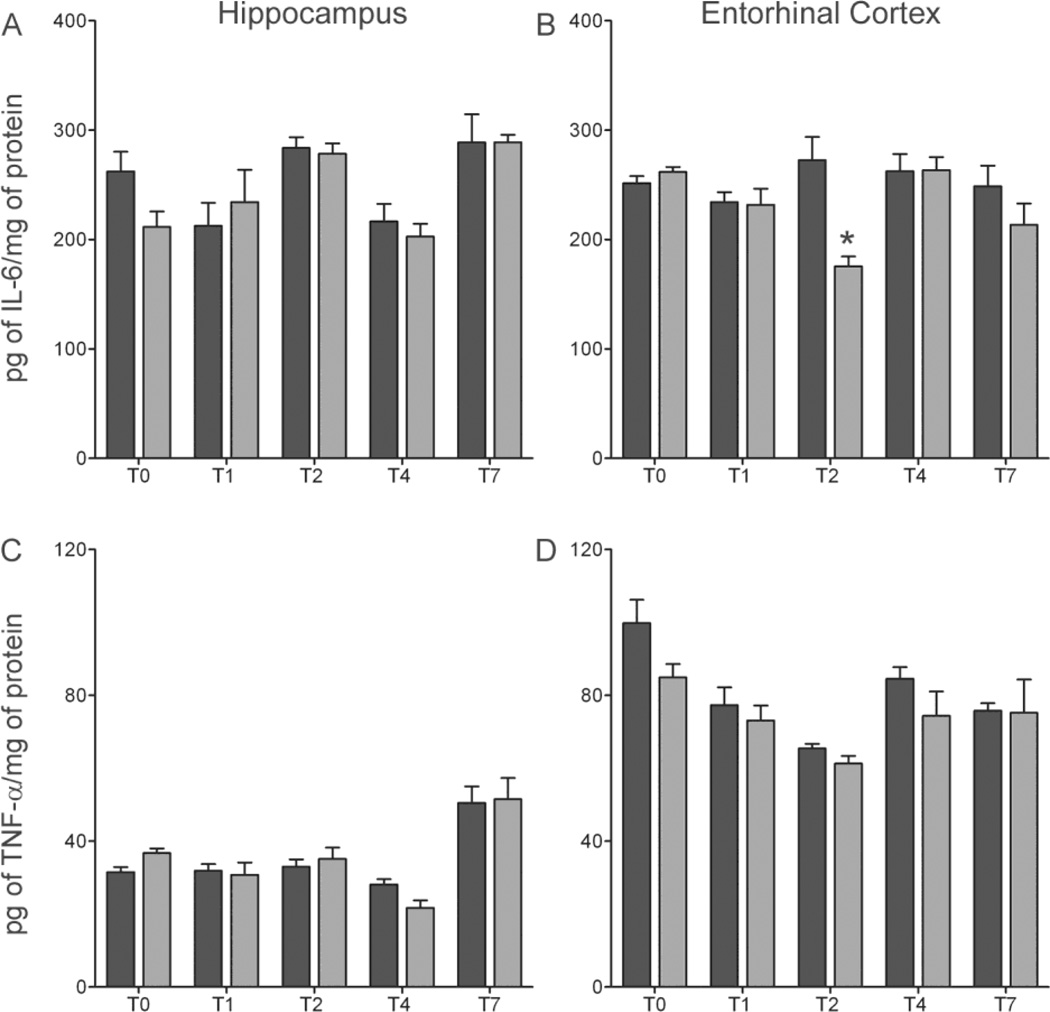
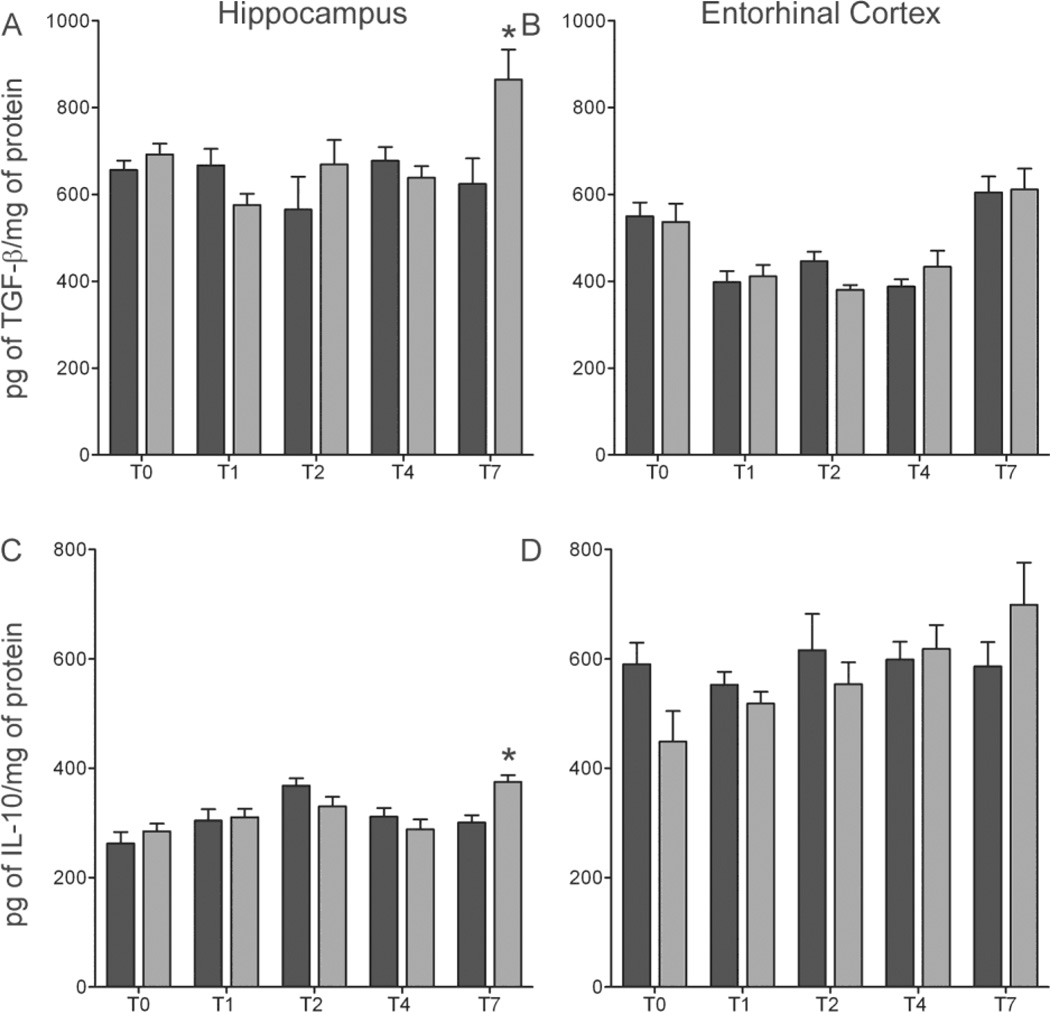
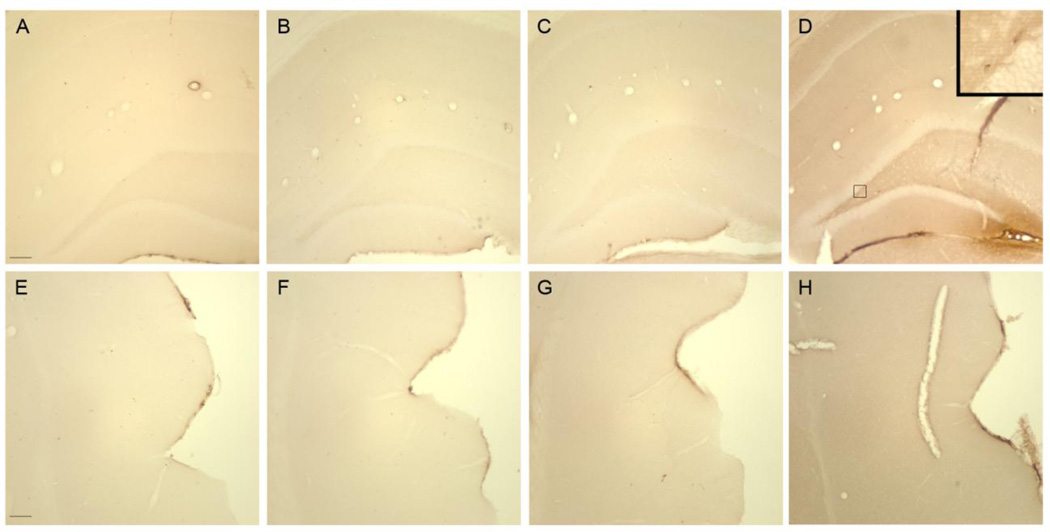
Excessive alcohol intake, a defining characteristic of an alcohol use disorder (AUD), results in neurodegeneration in the hippocampus and entorhinal cortex that has been linked to a variety of cognitive deficits. Neuroinflammation is thought to be a factor in alcohol-induced neurodegeneration, and microglia activation is a key but not sole component of an inflammatory response. These experiments investigate the effects of ethanol exposure in a well-accepted model of an AUD on both microglial activation and blood brain barrier disruption (BBB) in order to understand their relationship to classical definitions of inflammation and alcohol-induced neurodegeneration. Following a four-day binge ethanol paradigm, rat hippocampal and entorhinal cortex tissue was examined using three distinct approaches to determine microglia phenotype and BBB disruption: immunohistochemistry, autoradiography, and ELISA. After ethanol exposure, there was an increase in [(3)H]-PK-11195 binding and OX-42 immunoreactivity indicative of microglial activation; however, microglia were not fully activated since both OX-6 and ED-1 immunoreactive microglia were absent. This data was supported by functional evidence as there was no increase in the proinflammatory cytokines IL-6 or TNF-α, but a 26% increase in the anti-inflammatory cytokine, IL-10, and a 38% increase in the growth factor, TGF-β, seven days after exposure. Furthermore, there was no evidence of a disruption of the BBB. These data suggest that the four-day binge model of an AUD, which produces neurodegeneration in corticolimbic regions, does not elicit classical neuroinflammation but instead produces partially activated microglia. Partial activation of microglia following binge ethanol exposure suggest that microglia in this model have beneficial or homeostatic roles rather than directly contributing to neurodegeneration and are a consequence of alcohol-induced-damage instead of the source of damage.


Figures

Figure 1
Figure 1. [3H]-PK-11195 upregulation following 4-day binge exposure
Representative false color autoradiographs depicting [3H]-PK-11195 binding are shown for (A) controls (n=8; black bars) as well as (B) ethanol (grey bars) at T0 (n=6), (C) T2 (n=6), and (D) T7 (n=6). Quantitative analysis of the extent of binding are graphed for the (E) CA1, (F) CA2/3, (G) DG, and (H) entorhinal cortex. *p<0.05
Figure 2
Figure 2. CD11b (OX-42) upregulation following 4-day binge exposure
CD11b is upregulated in both the hippocampus and entorhinal cortex at T0 as shown in representative photomicrographs for (A, E) controls (T0: n=7; T28: n=7; black bars) and rats exposed to binge (C, F) ethanol (T0: n=8; T28: n=8; grey bars). Higher magnification of microglia seen in the hippocampus are shown for both (H) control and (I) ethanol. Quantifications of OX-42 immunoreactivity for the subregions of the hippocampus were significantly different and are shown: (B) CA1, (D), CA2/3, and (G) DG as well as the (J) entorhinal cortex. Scale bar in B=500µm; H=300µm; J=10µm. *p<0.05
Figure 3
Figure 3. Lack of fully activated microglia following 4-day binge exposure
ED-1 is not visible in the (A–D) hippocampus or (E–H) entorhinal cortex as seen in representative photomicrographs for (A, E) controls (T2: n=7; T7: n=8) or (B, F) ethanol (T2: n=6 ;T7: n=7) rats at (B, F) T2 or (C, G) T7. No OX-6 positive cells were visualized in the (I–L) hippocampus or (M–P) entorhinal cortex as seen in representative photomicrographs for (I, M) controls or ethanol rats at (J, N) T2 or (K, O) T7. Phagocytic and immune responsive macrophages were visible in the blood vessels as seen in insets (C) of ED-1 and (J) OX-6, respectively. ED-1 and immunopositive cells were visible in the (D, H, L, P) positive control tissue from a rat treated with kainic acid. RF=rhinal fissure. Scale bar= 150µm
Figure 4
Figure 4. Increase in microglia number following 4-day binge exposure
Stereological estimates indicate an increase in the number of microglia in ethanol treated animals (n=7; grey bars) compared with control (n=8; black bars) at T7 in the (A) CA1 (B) CA2/CA3, and (C) DG. This increase persists twenty-eight days later in the (B) CA2/3 in ethanols (n=7) compared with controls (n=7). There was no difference in cell counts determined by an image analysis program between ethanol and control at T7 in the (D) entorhinal cortex. *p<0.05
Figure 5
Figure 5. No pro-inflammatory cytokine expression in the 4-day binge
Concentrations of (A, B) IL-6, (C, D) TNF-α were determined by ELISA in both the hippocampus (A, C)) and entorhinal cortex (B, D). A 36% decrease of IL-6 was measured in the (B) entorhinal cortex at T2 in ethanol animals (n=7) [175pg/mg ± 8.9] compared to controls (n=7) [272pg/mg ± 21.2]; however, no change in TNF-α was seen in either the (E) hippocampus or the (F) entorhinal cortex. *p<0.05
Figure 6
Figure 6. Increase in anti—inflammatory cytokine expression after 7 days of abstinence
Concentrations of (A, B) TGF-β (C, D) IL-10 were determined by ELISA in both the hippocampus (A, C)) and entorhinal cortex (B, D). An increase in both (A) TGF-β (38%) (C) IL-10 (26%) was seen in ethanol animals (n=6,7) (grey bars) compared with controls (n=7;black bars) in the hippocampus at T7. *p<0.05
Figure 7
Figure 7. No disruption in the blood brain barrier (BBB)
There is no disruption in the BBB following ethanol as there is little to no IgG staining in either the (B, C, F, G) ethanol (T0: n=8; T2: n=6) or (A,E) control (T0 n=6; T2 n=7) compared with a (D,H) kainate positive control. Scale bar = 400 µm.

Similar articles

Cited by

References

    1. Abdul Muneer PM, Alikunju S, Szlachetka AM, Haorah J. The mechanisms of cerebral vascular dysfunction and neuroinflammation by MMP-mediated degradation of VEGFR-2 in alcohol ingestion. Arterioscler Thromb Vasc Biol. 2012;32:1167–1177. - PMC - PubMed
    1. Agrawal RG, Hewetson A, George CM, Syapin PJ, Bergeson SE. Minocycline reduces ethanol drinking. Brain Behav Immun. 2011;25(Suppl 1):S165–S169. - PMC - PubMed
    1. Akiyama H, McGeer PL. Brain microglia constitutively express beta-2 integrins. J Neuroimmunol. 1990;30:81–93. - PubMed
    1. Alfonso-Loeches S, Pascual-Lucas M, Blanco AM, Sanchez-Vera I, Guerri C. Pivotal role of TLR4 receptors in alcohol-induced neuroinflammation and brain damage. J Neurosci. 2010;30:8285–8295. - PMC - PubMed
    1. Banati RB, Gehrmann J, Schubert P, Kreutzberg GW. Cytotoxicity of microglia. Glia. 1993;7:111–118. - PubMed

Publication types

MeSH terms