. 2013 Jan 17;152(1-2):82-96.
doi: 10.1016/j.cell.2012.11.045. Epub 2013 Jan 11.

Direct conversion of fibroblasts to neurons by reprogramming PTB-regulated microRNA circuits

Affiliations

Direct conversion of fibroblasts to neurons by reprogramming PTB-regulated microRNA circuits

Yuanchao Xue et al. Cell. .

Abstract

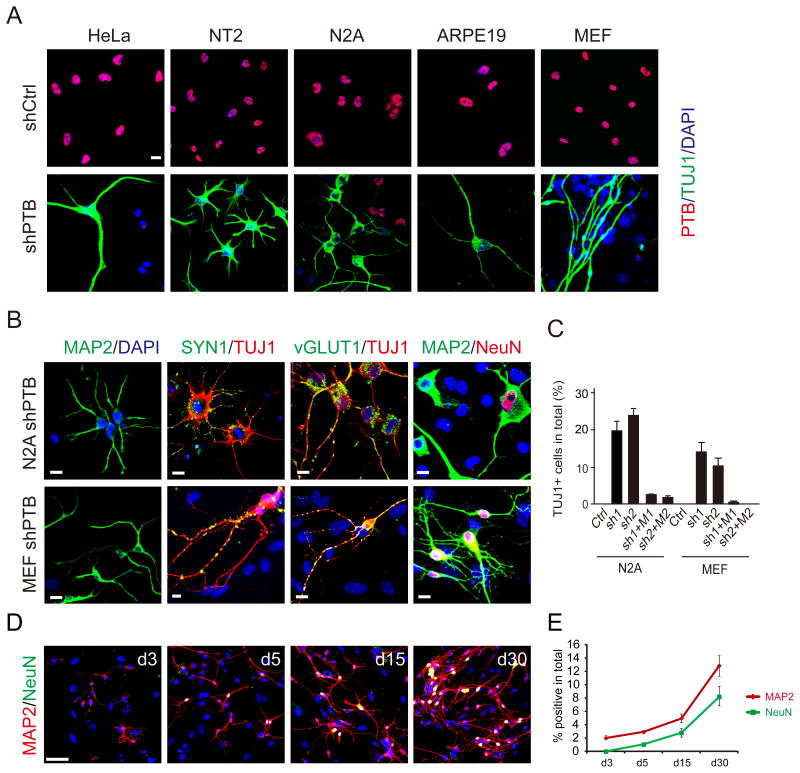
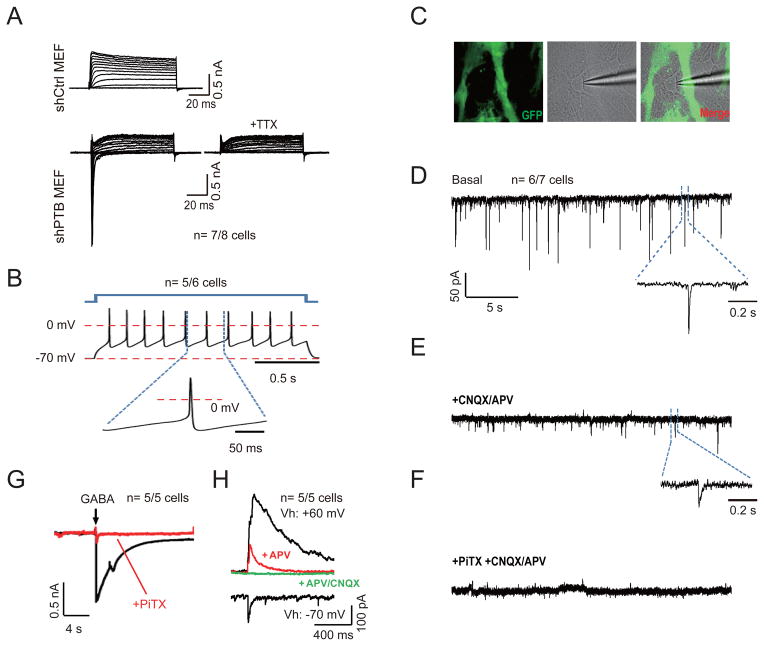
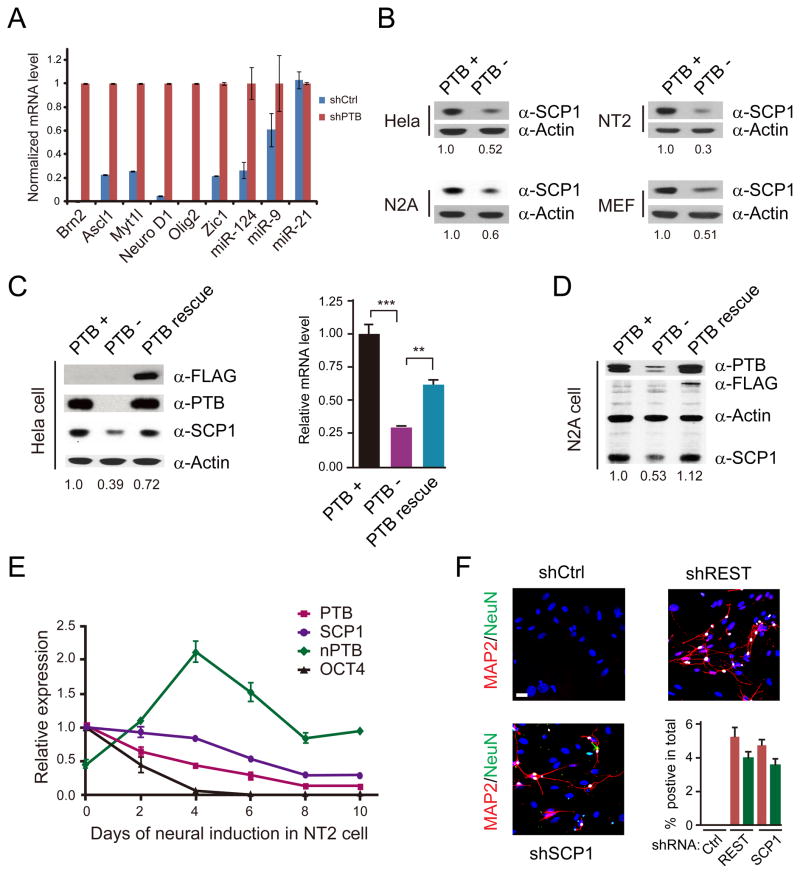
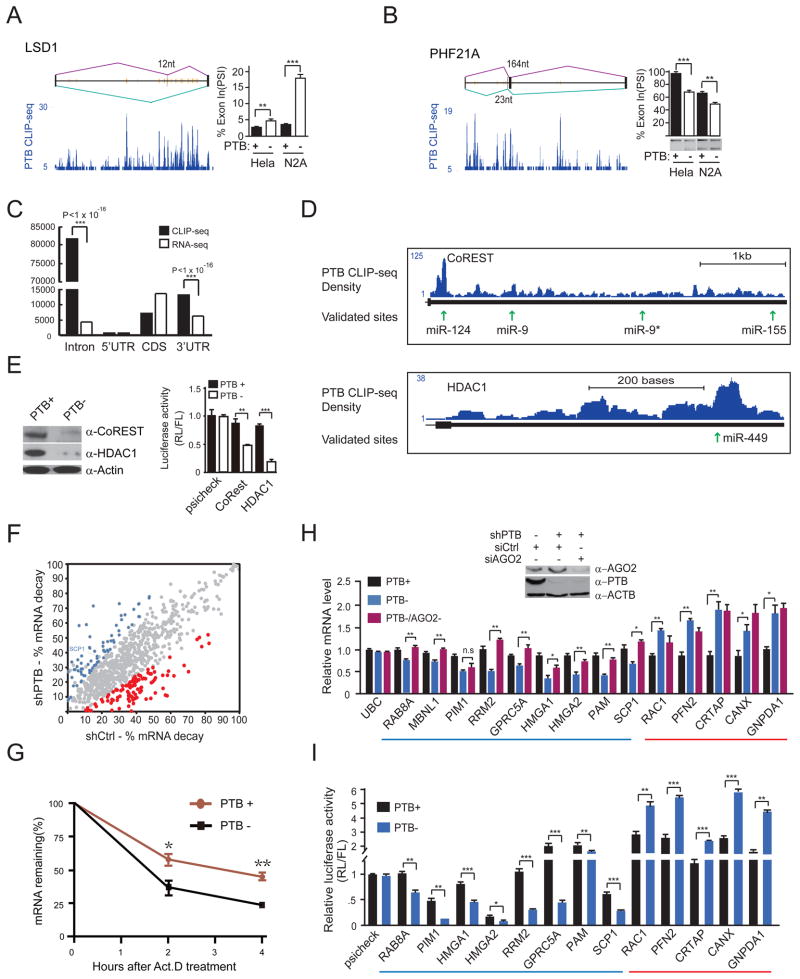
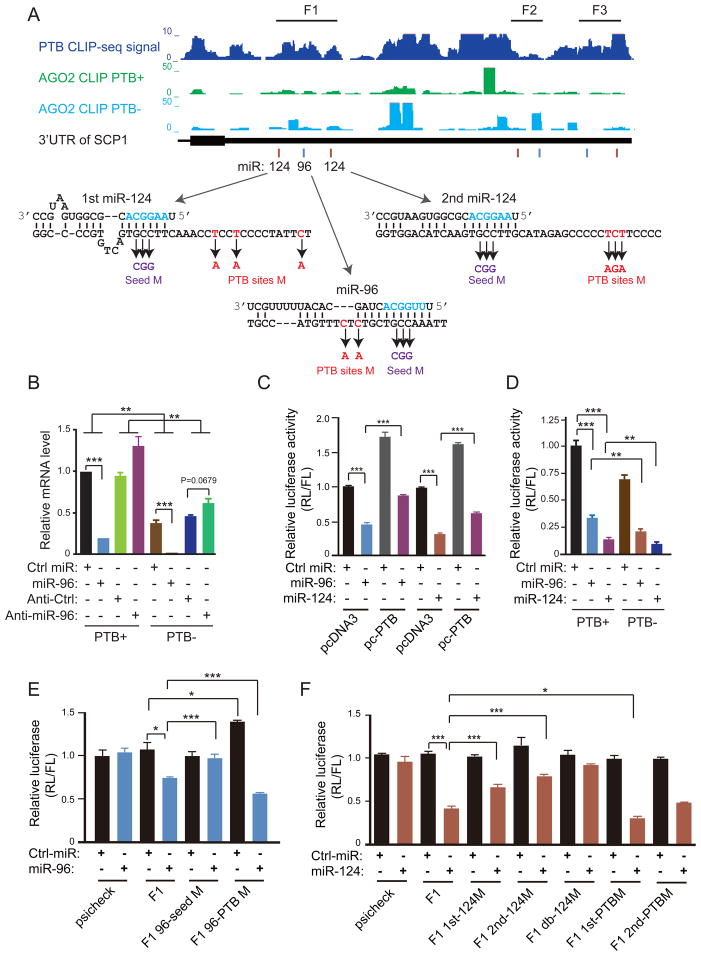
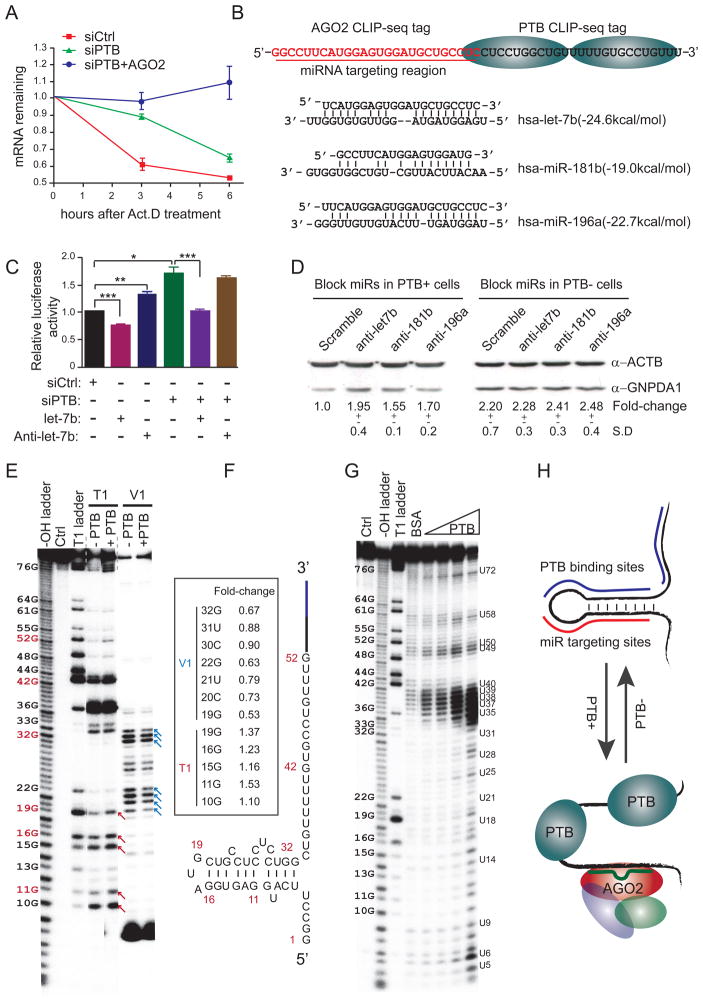
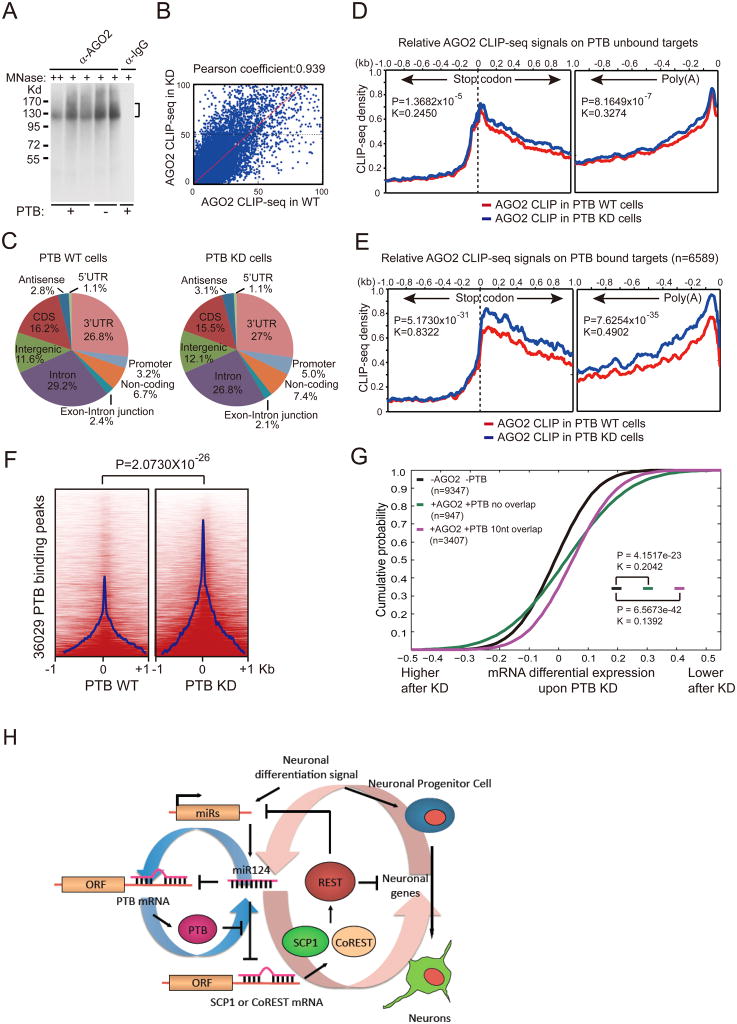
The induction of pluripotency or trans-differentiation of one cell type to another can be accomplished with cell-lineage-specific transcription factors. Here, we report that repression of a single RNA binding polypyrimidine-tract-binding (PTB) protein, which occurs during normal brain development via the action of miR-124, is sufficient to induce trans-differentiation of fibroblasts into functional neurons. Besides its traditional role in regulated splicing, we show that PTB has a previously undocumented function in the regulation of microRNA functions, suppressing or enhancing microRNA targeting by competitive binding on target mRNA or altering local RNA secondary structure. A key event during neuronal induction is the relief of PTB-mediated blockage of microRNA action on multiple components of the REST complex, thereby derepressing a large array of neuronal genes, including miR-124 and multiple neuronal-specific transcription factors, in nonneuronal cells. This converts a negative feedback loop to a positive one to elicit cellular reprogramming to the neuronal lineage.


Figures

Figure 1
Figure 1. Differentiation of diverse cell types into neuronal-like cells in response to PTB knockdown
(A) Induction of neuronal morphology and the expression of the neuronal marker Tuj1 in multiple cell types in response to depletion of PTB. Scale bar: 20 μm. (B) Characterization of two cell types (N2A and MEF) with additional neural markers. Typical punctate staining is evident (yellow) with antibodies against Synapsin and vGLUT1. Scale bar: 20 μm. (C) Quantification of induced neuronal-like cells derived from N2A and MEFs. The data were based on positive Tuj1 stained cells divided by initial plating cells in response to two separate shPTBs (sh1 and sh2). The effect could be efficiently rescued with the corresponding shRNA-resistant PTB expression units that contain mutations in the corresponding target sites (M1 and M2). Data are shown as mean ± SD. (D) Time course analysis of neuronal induction on shPTB-treated MEFs after switching to N3 media. MAP2 and NeuN were stained at indicated time points. Scale bar: 60 μm (E) Quantified temporal profile of PTB knockdown-induced neurons. Data shown as mean ± SD are based on 4 equivalent areas shown in D. See also Figure S1.
Figure 2
Figure 2. Synaptic activities on neurons derived from shPTB-induced MEFs
(A) Representative traces of whole-cell currents on control shRNA-treated (top) and shPTB-treated (bottom) MEFs. Only shPTB-treated MEFs exhibited fast inward sodium currents, which could be blocked by 1 μM sodium channel inhibitor TTX. (B) Representative trace of action potentials in response to step current injections on shPTB-induced neurons after co-culturing with rat glial cells. (C) Image of an shPTB-induced neuron co-cultured with GFP-marked rat glial cells. Recording electrode was patched on the shPTB-induced neuron (middle and right). (D to F) Representative traces of spontaneous postsynaptic currents on shPTB-induced neurons (D). The cell was held at −70mV, revealing events of various amplitudes and frequencies. The insert shows a representative trace of synaptic response. Glutamategic synaptic currents were blocked with 20 μM CNQX plus 50 μM APV (E). The insert highlights the remaining GABA current. GABA currents were blocked with 50 μM PiTX (F). (G) Induction of GABA currents by focal application of 1 mM GABA, which could be blocked by PiTX (red). (H) Representative trace of synaptic currents recorded on shPTB-induced neurons. Vh: holding potential. AMPA-R mediated EPSC was recorded at −70mV. Blockage of Mg++ to NMDA-R was relieved at +60mV, revealing both AMPA and NMDA EPSCs, which could be sequentially blocked with 50 μM APV (antagonist of NMDA-type glutamate receptors) and 20 μM CNQX (antagonist of AMPA receptors). The number of cells that show the representative response against total cells examined is indicated in each panel. See also Figure S2.
Figure 3
Figure 3. De-repression of neuronal-specific genes in response to PTB knockdown
(A) RT-qPCR analysis of a panel of transcription factors and microRNAs in shPTB-treated MEFs. Data are normalized against Actin; miR-21 served as a negative control. (B) Down-regulation of SCP1 in multiple cell types determined by Western blotting. (C and D) Rescue of SCP1 expression in PTB knockdown cells by an shRNA-resistant PTB in HeLa (C) and N2A (D) cells. (E) Time course analysis of neural induction by retinoic acid (RA) on NT2 cells analyzed by RT-qPCR. Oct4 was analyzed as a control. Data are shown as mean ± SD. (F) Induction of neuronal differentiation on MEFs with shRNA against SCP1 or REST. The induction efficiency was calculated based on the number of cells with positive MAP2 and NeuN staining divided by total plating cells. Data are shown as mean ± SD. See also Figure S3.
Figure 4
Figure 4. PTB-regulated splicing and RNA stability
(A and B) PTB-regulated alternative splicing of LSD1 and PHF21A. The CLIP-seq mapped PTB binding events (blue) are shown along with deduced PTB binding peaks (orange lines) on each gene model. PTB knockdown induced alternative splicing was determined by RT-qPCR in the case of LSD1 and by semi-quantitative RT-PCR in the case of PHF21A. (C) Relative enrichment of PTB binding in intronic and 3′UTR regions. Significant enrichment of PTB binding events is indicated by the p-values in each case. (D) PTB binding on two REST component genes, showing that multiple PTB binding peaks overlap with validated targeting sites by miR-124 and miR-9. (E) Reduced CoREST and HDAC1 proteins (left) and diminished reporter activities (right) in PTB-depleted HeLa cells. (F) Genome-wide analysis of PTB-regulated RNA stability. The calculated decay rate was compared in the presence (shCtrl-treated) or absence (shPTB-treated) of PTB. Genes with increased and decreased decay are highlighted in red and blue, respectively, based on triplicated RNA-seq data (p<0.05). (G) Accelerated SCP1 mRNA decay detected by RT-qPCR in PTB-depleted HeLa cells. (H) The effect of knocking down PTB (PTB−) or both PTB and Ago2 (PTB−/Ago2−) on the expression of a panel of genes that show PTB and Ago2 binding events in their 3′UTRs. A gene (UBC) without binding evidence for PTB and Ago2 severed as a negative control. (I) Re-capture of PTB-dependent regulation with the 3′UTR of individual genes analyzed in H. Note that the MBNL1 gene was not included in this analysis because its 3′UTR is too long to clone. Data in individual panels are shown as mean ± SD. **p<0.01; ***p<0.001. See also Figure S4.
Figure 5
Figure 5. PTB competition with microRNA targeting in the 3′UTR of SCP1
(A) The mapped PTB binding events in the 3′UTR of the SCP1 gene (top). Above the gene model also show the mapped Ago2 binding density before (green) and after (cyan) PTB knockdown in HeLa cells. Below the gene model indicate multiple predicted microRNA target sites for miR-124 (brown lines) and miR-96 (cyan lines). Arrow-highlighted are deduced base-paired regions between the mRNA and individual microRNAs. Also illustrated are the mutations in the 3′UTR of the SCP1 gene that correspond to the sequence on the microRNA targeting sites in the seed region (violet) or on the PTB binding site (red) in each case. (B) The effects on the endogenous SCP1 mRNA by overexpressed miR-96 and its antagomir before and after PTB knockdown. (C) Blockage of the effect of overexpressed miR-96 and miR-124 by PTB overexpression on the luciferase reporter containing the F1 fragment from the SCP13′UTR. (D) Enhanced effect of overexpressed miR-96 and miR-124 in response to PTB knockdown on the luciferase reporter containing the F1 fragment from the SCP13′UTR. (E) The requirement for the seed region in the miR-96 target site to respond to overexpressed miR-96. While the mutations in the PTB binding site impaired miR-96 targeting (compared lanes 3 and 7), the mutants enhanced the overall effect of miR-96 on the luciferase reporter (compare lanes 3/4 and lanes 7/8). (F) Contribution of individual miR-124 target sites in the SCP1 F1 region to microRNA-mediated down-regulation of the luciferase activity. The mutations in the seed region of miR-124 targeting sites progressively reduced the response to overexpressed miR-124 (compare lanes 3 to 10). The mutations in the PTB binding site near the first miR-124 targeting sites enhanced miR-124 mediated down-regulation (compare lanes 4 and 12). The statistical significance in comparing different groups was determined by paired t-test. Data in individual panels are shown as mean ± SD. **p<0.01; ***p<0.001. See also Figure S5.
Figure 6
Figure 6. Enhanced microRNA targeting by modulatingRNA secondary structure
(A) Stabilization of the GNPDA1 transcript in response to PTB and/or Ago2 knockdown in the presence of the transcription inhibitor Act.D. (B) Potential microRNA targeting sites near the mapped PTB binding site in the 3′UTR of GNPDA1. (C) Overexpressed Let-7b suppressed and antagomir Let-7b enhanced the expression of the luciferase reporter containing the 3′UTR of GNPDA1 (lanes 1 to 3). PTB knockdown enhanced the luciferase activity (compared between lanes 1 and 4). Overexpression of Let-7b still suppressed the luciferase activity, but anti-Let-7b no longer showed the effect in PTB knockdown cells. (D) Antagomir Let-7b, miR-196a and miR-181b increased GNPDA1 protein in the presence, but not absence, of PTB in transfected HeLa cells. The protein levels were quantified with the SD shown in the bottom. (E and F) Mapping the secondary structure in the 3′UTR of GNPDA1. Individual G residues were labeled on the left with red indicating several key positions in the deduced secondary structure (E), as modeled (F). Red and blue arrows respectively indicate PTB enhanced and suppressed cleavages in the deduced stem-loop region. Quantified fold-changes at key positions are indicated in the box inserted in panel F. (G and H) Increased single-strandness of RNA in the presence of increasing amounts of PTB detected by in-line probing (G). A proposed model indicates PTB-mediated opening of the stem-loop that facilitates microRNA targeting (H). Data in A, C, and D are shown as mean ± SD. *p<0.05; **p<0.01; ***p<0.001. See also Figure S6.
Figure 7
Figure 7. Global analysis of Ago2 binding in response to PTB knockdown
(A) CLIP signals detected with anti-Ago2 before and after PTB knockdown. No signal was detected with IgG control. (B) Comparison between the two Ago2 CLIP-seq datasets in 1kb windows across the human genome before and after PTB depletion. (C) Genomic distribution of Ago2 binding events before (left) and after (right) PTB knockdown, showing prevalent Ago2 binding in the 3′UTR region. (D and E) Ago2 binding in the 3′UTR of PTB unbound (D) and bound (E) targets before (red) and after (blue) PTB knockdown. Dramatic differences were detected on PTB bound targets (n=6589) in E, which compares to much less responses on a similar number of randomly selected PTB unbound targets in D. Statistical significance was determined for the differences on both the stop codon and poly (A) sides by two-tailed Kolmogorov-Smirnov test with both the p- and k-values shown in the insert. (F) Induction of significant Ago2 binding on and near the PTB binding sites. The p-value for the differences is indicated on the top. (G) Functional correlation between PTB/microRNA interplay and gene expression. Genes with induced and repressed expression are plotted in a cumulative fashion. Statistical significance was determined by KS-test. (H)Model for the PTB-regulated miR124-REST loop. See also Figure S7.

References

    1. Amit I, Garber M, Chevrier N, Leite AP, Donner Y, Eisenhaure T, Guttman M, Grenier JK, Li W, Zuk O, et al. Unbiased reconstruction of a mammalian transcriptional network mediating pathogen responses. Science. 2009;326:257–263. - PMC - PubMed
    1. Aoki H, Hara A, Era T, Kunisada T, Yamada Y. Genetic ablation of Rest leads to in vitro-specific derepression of neuronal genes during neurogenesis. Development. 2012;139:667–677. - PubMed
    1. Auld KL, Silver PA. Transcriptional regulation by the proteasome as a mechanism for cellular protein homeostasis. Cell Cycle. 2006;5:1503–1505. - PubMed
    1. Ballas N, Grunseich C, Lu DD, Speh JC, Mandel G. REST and its corepressors mediate plasticity of neuronal gene chromatin throughout neurogenesis. Cell. 2005;121:645–657. - PubMed
    1. Bartel DP. MicroRNAs: target recognition and regulatory functions. Cell. 2009;136:215–233. - PMC - PubMed

Publication types

Associated data